
Key Points
- Gold is sitting on its demand zone between 4,100 and 4,120 with two bull RSI divergences signalling that the sell off from 4,200 is losing steam. The weak NFP print (57,000 versus 110,000 expected) has cut September rate hike odds to roughly 50%, removing a headwind for gold in the near term. This is a buy the dip setup targeting a move back toward 4,160 and potentially 4,190.
- USD/JPY has been rejected from the 162.400 high with two bear RSI divergences confirming momentum exhaustion at the top. Japan’s Finance Minister has reiterated that authorities stand ready to intervene “at any time” and reports suggest Japan may stop signaling its intervention plans in advance to catch traders off guard. A sell the retest setup at 162.000 to 162.100 targets a move toward 161.400.
- The Dow Jones (US30) is printing its third consecutive bear RSI divergence at the 53,100 high. Each push higher arrives with less momentum than the last, and with NFP confirming a cooling labour market, the index looks vulnerable to a pullback toward the demand zone at 52,780 to 52,850.
Trade 1: XAUUSD Long from Demand
| Pair | Direction | Entry Zone | Target 1 | Target 2 | Invalidation |
| XAUUSD | Long | 4,100 to 4,130 | 4,160 | 4,190 | Below 4,095 |
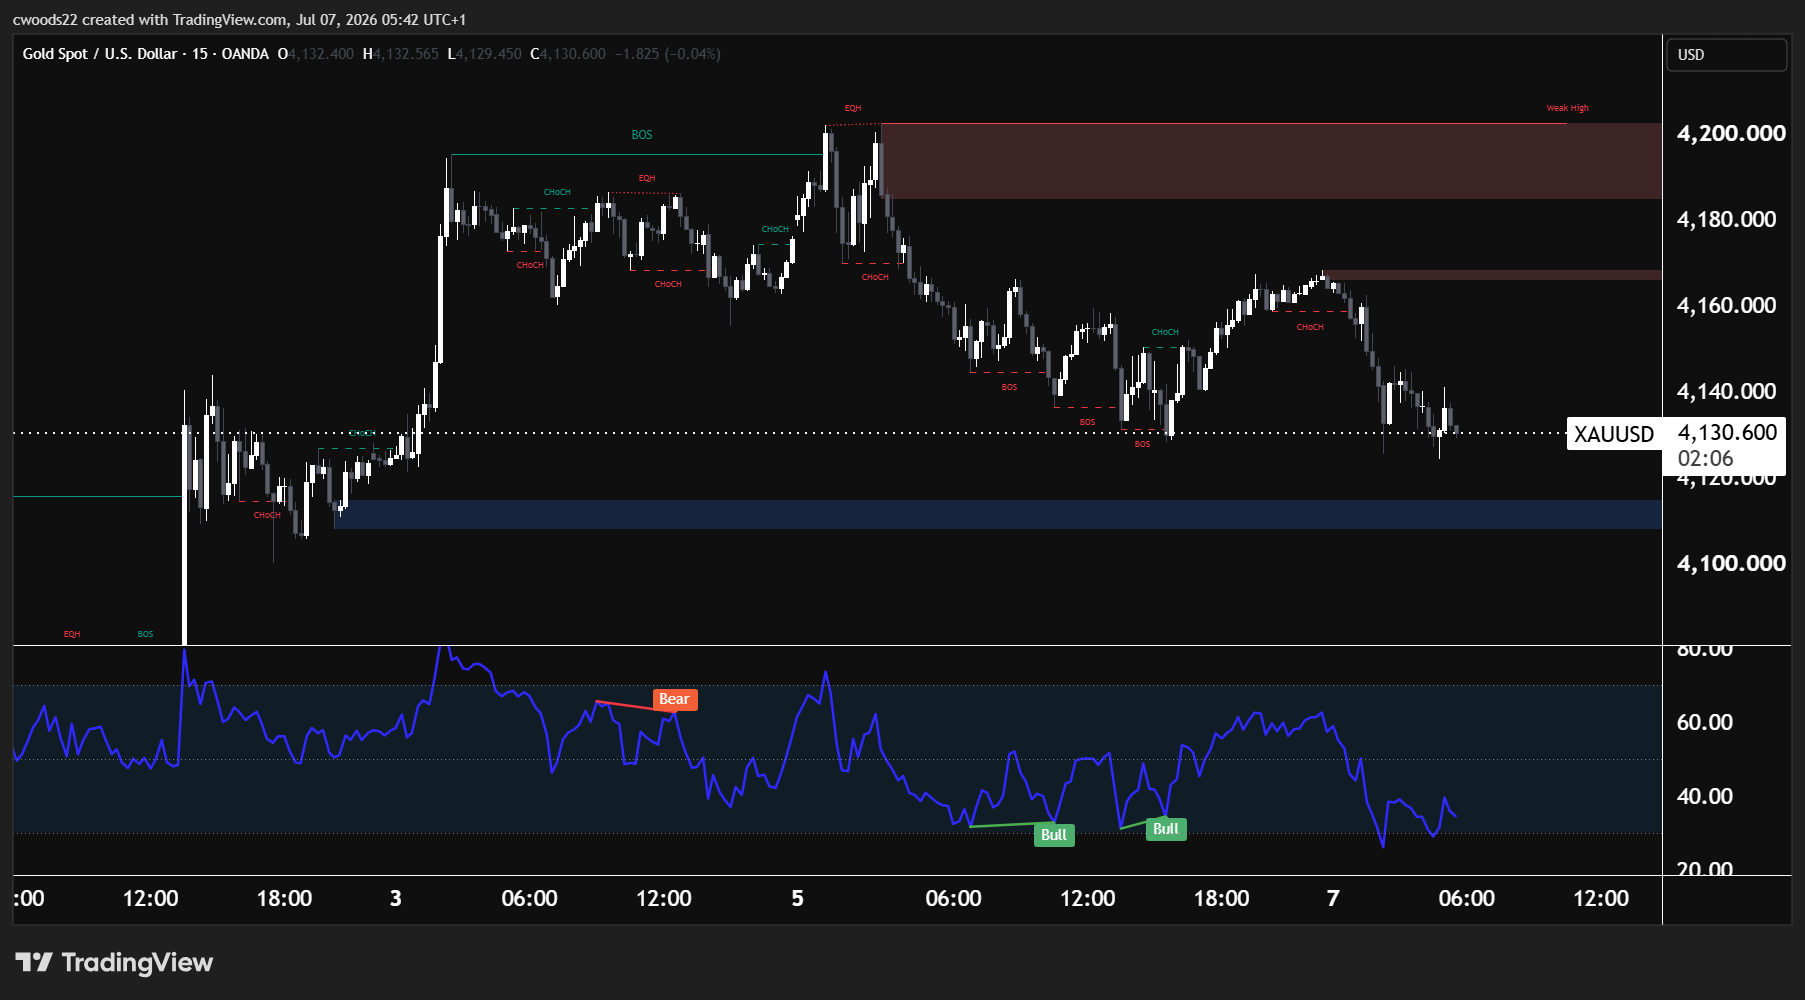
Chart: Gold Spot, 15min timeframe (TradingView, SMC)
The 15 minute chart shows gold completing a full cycle. Price rallied from the equal highs and break of structure area below 4,100 up to 4,205, where it printed a break of structure to the upside. The supply zone between 4,190 and 4,210 (the red shaded area) capped the advance, and a series of bearish change of character signals confirmed that sellers had retaken control above 4,180.
The sell off was sharp but controlled. Price has now reached the demand zone between 4,100 and 4,120 (the blue shaded area), and this is where the opportunity sits. Two bull RSI divergences have appeared at the lows: price made lower lows while RSI made higher lows, a classic signal that selling pressure is fading. This is the same pattern that preceded the initial rally from sub 4,100 levels.
The entry zone is between 4,100 and 4,130, which is where price currently sits. The first target is 4,160, which represents the previous change of character level where structure last shifted bearish. The extended target is 4,190, the lower edge of the supply zone. Invalidation sits below 4,095, where a break would suggest the demand zone has failed and a deeper move toward 4,050 is likely.
The fundamental backdrop supports this setup. Thursday’s NFP miss (57,000 versus 110,000) has reduced the probability of a September Fed rate hike from roughly two thirds to around 50%. Lower rate expectations weaken the dollar, which is typically positive for gold. Wednesday’s FOMC minutes could provide the next catalyst: any language suggesting the Fed is less hawkish than the dot plot implied would be a tailwind for this trade.
Trade 2: USD/JPY Short from Rejection
| Pair | Direction | Entry Zone | Target 1 | Target 2 | Invalidation |
| USD/JPY | Short | 162.000 to 162.100 | 161.400 | 161.000 | Above 162.450 |
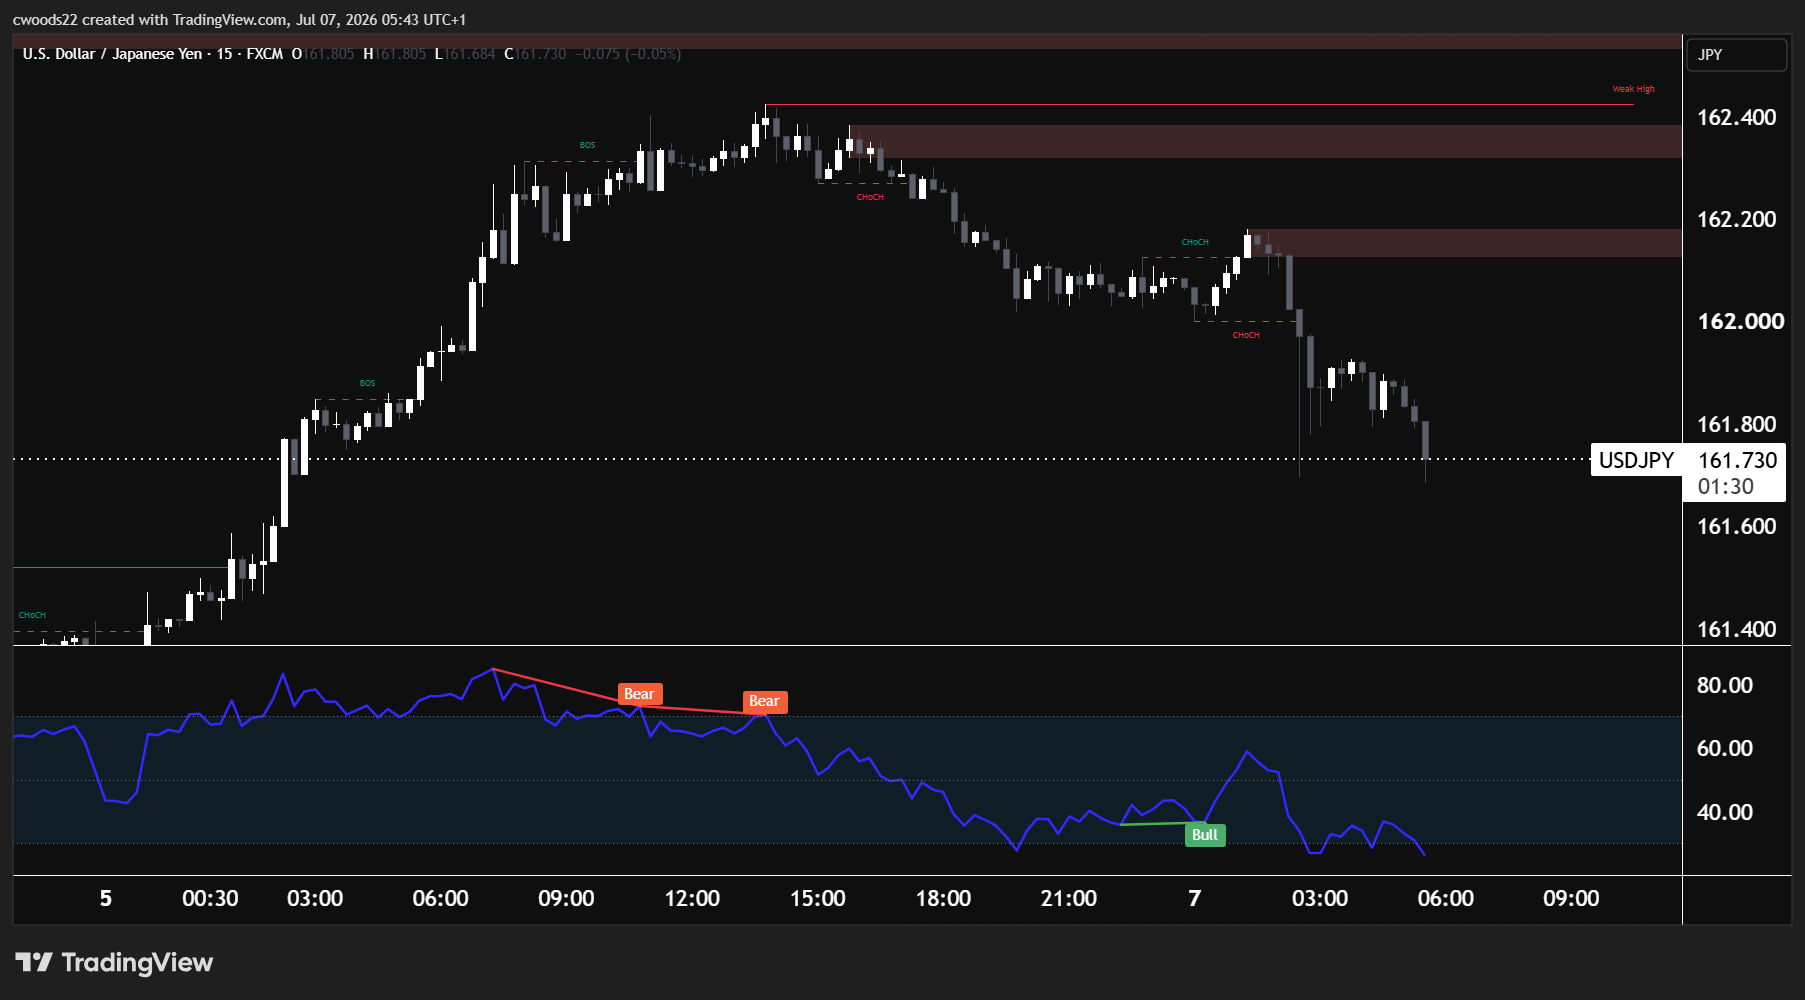
Chart: USD/JPY, 15min timeframe (TradingView, SMC)
USD/JPY rallied aggressively from 161.350 to 162.400 before hitting a wall. The high at 162.400 represents the ceiling, and the supply zone between 162.100 and 162.400 is where the break of structure to the upside occurred. That level is now acting as resistance rather than support after the bearish change of character at 162.200.
The RSI tells the story clearly. Two bear divergences appeared at the top: price pushed to higher highs above 162.200 while RSI made lower highs, warning that the rally was running on fumes. The subsequent breakdown through 162.000 confirmed the shift in control from buyers to sellers.
The trade idea is to sell on any retest of the 162.000 to 162.100 area, which represents the previous break of structure level that has now flipped to resistance. The first target is 161.400, near the change of character level at the bottom left of the chart where the original bullish move began. The extended target is 161.000, a round number psychological level. Invalidation sits above 162.450, which would represent a reclaim of the high and invalidate the bearish structure.
The fundamental case adds weight. Japan spent $74 billion on yen intervention in the first half of 2026 and the BOJ has raised rates to 1.00%. Finance Minister Katayama has stated that authorities stand ready to intervene “at any time,” and Reuters reported that Japan may stop signaling its intervention plans in advance, a shift designed to catch speculative traders off guard. The combination of stretched speculative positioning and active intervention risk makes the long side of USD/JPY increasingly dangerous. Retail traders are 26% long and 74% short, which typically acts as a contrarian signal, but in this case the institutional and intervention backdrop aligns with the short thesis.
Trade 3: US30 Short from the High
| Pair | Direction | Entry Zone | Target 1 | Target 2 | Invalidation |
| US30 | Short | 53,050 to 53,100 | 52,850 | 52,600 | Above 53,150 |
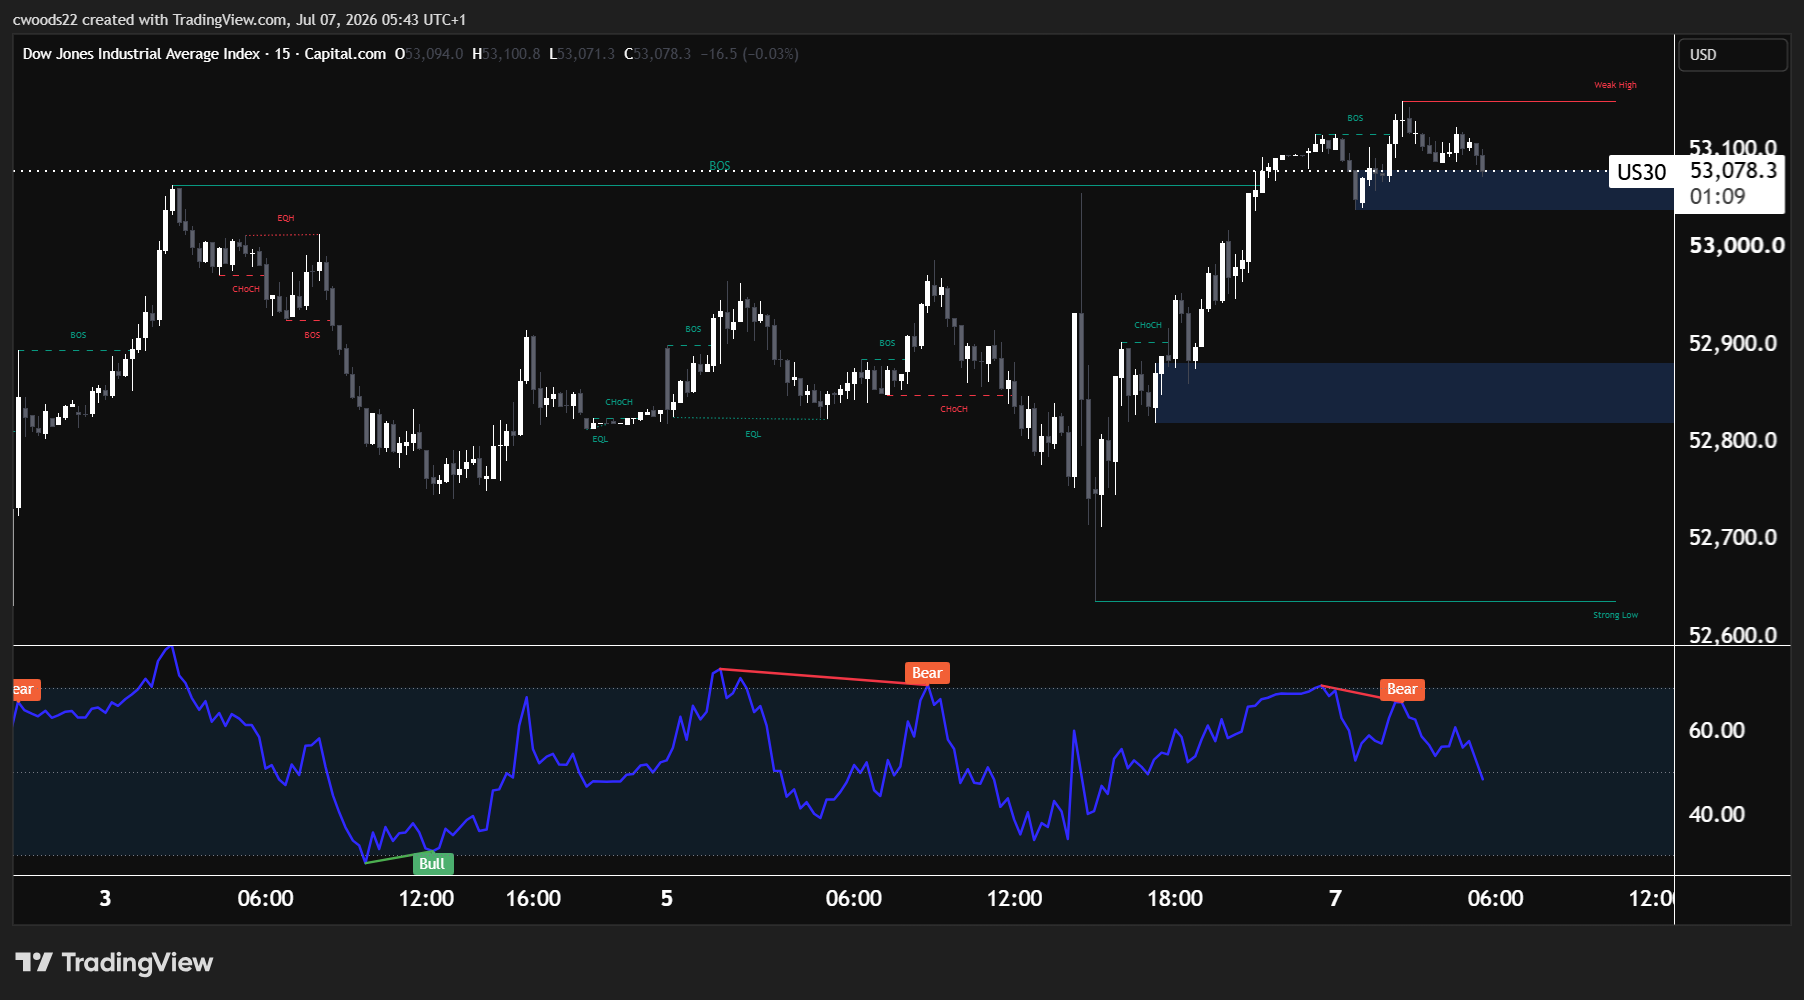
Chart: Dow Jones, 15min timeframe (TradingView, SMC)
The Dow Jones 15 minute chart is sending a clear warning. Price has rallied from the low at 52,600 through a series of structural shifts, printing multiple break of structure and change of character signals on the way up. The current price sits at 53,078, just below the high at approximately 53,100 to 53,120.
The problem is the RSI. Three bear divergences have appeared across this move: one at the far left of the chart, one in the middle, and one forming right now. Each successive push to higher prices has been met with lower RSI highs. This is the most persistent divergence pattern of the three setups in this edition, and it suggests that the momentum driving this rally is exhausting.
The sell zone is the current area between 53,050 and 53,100 (near the high). The first target is the demand zone between 52,780 and 52,850, where the equal lows sit and where buyers previously stepped in. The extended target is the low at 52,600, which represents the structural floor for this entire move. Invalidation sits above 53,150, where a clean break would confirm that the high has been taken and the bullish structure remains intact.
The macro context supports caution at these levels. The NFP miss (57,000 jobs versus 110,000 expected) confirms that the labour market is cooling faster than expected. The leisure and hospitality sector shed 61,000 jobs, partly distorted by the World Cup, but the headline number still raises questions about the strength of the US economy heading into Q2 earnings season. With FOMC minutes on Wednesday and the market already pricing in uncertainty around the Fed’s next move, the Dow looks vulnerable to profit taking from these elevated levels.
Risk Warning: Trading financial instruments, particularly those involving leverage, involves a substantial degree of risk and is not appropriate for all investors. The value of your investments can rise or fall sharply, and it is possible to lose the entirety of your invested capital. Do not trade with funds you cannot afford to lose. Nothing in this site should be read or construed as constituting advice on the part of Taurex or any of its affiliates, directors, officers or employees.