
Key Points
- Gold and crude oil have historically moved in the same direction during geopolitical crises, but the Iran conflict has broken that relationship. The 90 day correlation between the two assets has flipped to negative 0.51, down from a long run average of positive 0.06. Oil is up 24% from its June lows while gold is still 26% below its February highs.
- The mechanism is straightforward: rising oil prices feed directly into inflation expectations, which keeps the Fed locked at 3.50% to 3.75% and pushes real yields to their highest level in 18 years. The 10 year TIPS yield has reached 2.31%, creating a headwind that safe haven demand alone cannot overcome.
- Central banks continue to accumulate gold at roughly 1,000 tonnes per year, with Poland adding 64 tonnes year to date. This structural bid is preventing an even deeper correction, but it is not enough to offset the macro headwinds from oil driven inflation. The resolution of the Iran conflict, or its further escalation, will determine which force wins.
The Disconnect
If you had told me a year ago that the US would be conducting consecutive nightly strikes on Iran, that the Strait of Hormuz would be closed to commercial shipping, and that oil would have rallied 24% in two weeks, I would have told you gold was heading to $6,000. Instead, gold is sitting at $4,127, roughly 26% below its February highs. That disconnect is the most important cross-asset story in markets right now, and it is the one I want to walk you through today.
The chart below shows gold (candlesticks) overlaid with WTI crude oil (blue line) on the daily timeframe, covering the past twelve months. What jumps out immediately is how these two assets, which traditionally move together during periods of geopolitical stress, have completely decoupled in 2026.
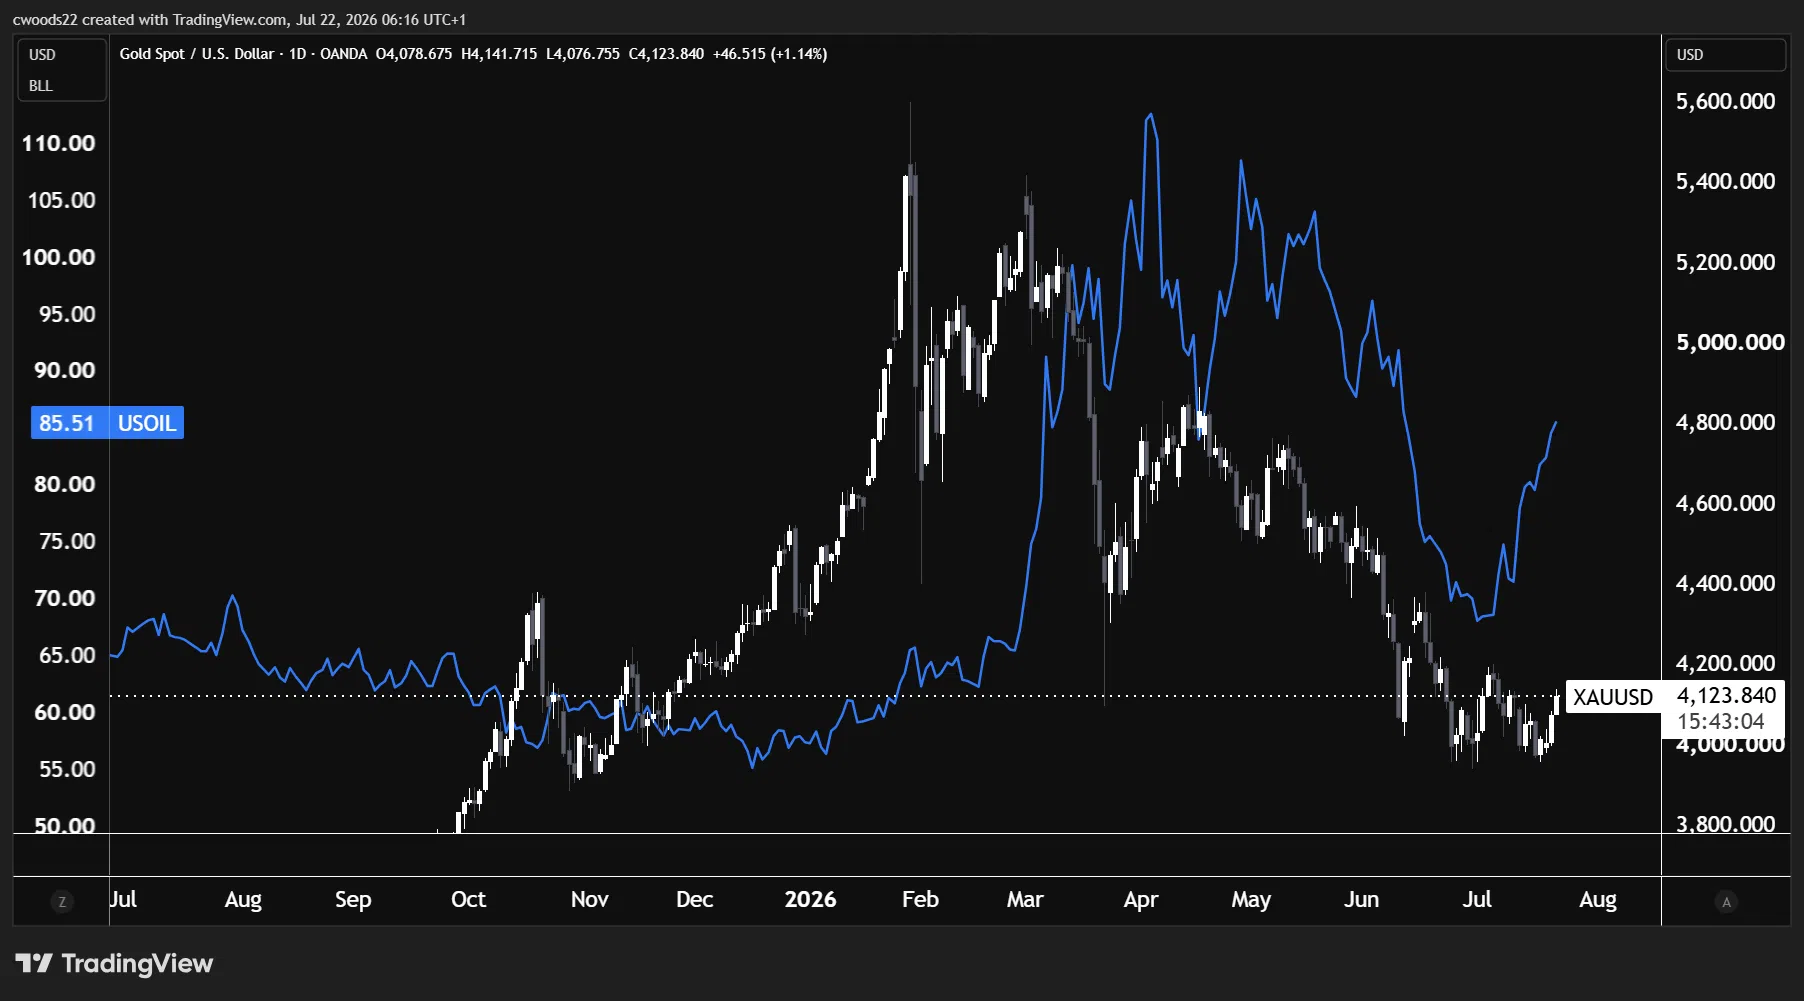
Chart: Gold (XAUUSD, candlesticks) vs WTI crude (USOIL, blue line), daily timeframe (TradingView)
How We Got Here
Look at the left side of the chart first, from July to December 2025. Both assets were drifting lower in tandem. Oil slid from $65 to a low near $50 in October. Gold pulled back from $4,200 to $3,800 over a similar period. The positive correlation was intact: falling risk appetite, weakening demand expectations, and a strong dollar weighed on both.
Then December 2025 into January 2026 happened. Gold launched into a parabolic rally, driven by a combination of rate cut expectations, central bank buying, and an aggressive options driven squeeze in the futures market. By late January, gold had reached $5,580, its all time high. Oil, meanwhile, was still languishing around $60 to $62. That was the first sign that the traditional relationship was starting to break.
The CME raised margin requirements on gold from 6% to 8% in late January, which forced leveraged speculators to liquidate. Gold crashed 9% in a single day. Then the Iran conflict escalated on February 27 and the paradox took hold.
The Paradox Explained
Here is the mechanism, and it is worth understanding clearly because it explains why the usual playbook of “war equals buy gold” has not worked this time.
When oil prices rise because of a genuine supply disruption (not demand driven growth), they feed directly into headline inflation. The June US CPI print came in at 3.5% (down from 3.8%), but that improvement was captured during the brief ceasefire window when oil had fallen back toward $58. With the ceasefire now collapsed and oil back at $85, the July CPI print will almost certainly re-accelerate.
Higher inflation keeps the Fed pinned at 3.50% to 3.75%. Chair Warsh has made it clear he is in no rush to cut, and the re-acceleration in energy prices removes any justification for easing. That means real yields stay elevated. The 10 year TIPS yield hit 2.31% last week, the highest in nearly 18 years. For an asset like gold that pays no income, a guaranteed real return of 2.31% from US Treasuries is a powerful competitor.
And there is a second channel. The United States is now one of the world’s largest energy exporters. When oil prices surge on a Middle Eastern supply disruption, US energy revenues actually increase. That strengthens the dollar on a terms of trade basis, adding another headwind for gold, which is priced in dollars.
So the same event (Iran escalation) produces two simultaneous forces on gold: safe haven demand pulling it up, and rising real yields plus a stronger dollar pulling it down. Right now, the macro headwinds are winning.
The Correlation Has Flipped
The 90 day rolling correlation between gold and WTI crude has fallen to negative 0.51. The long run average is positive 0.06. In plain terms, they have gone from loosely connected to actively moving in opposite directions. The gold to oil ratio sits at roughly 47 barrels per ounce, more than double the historical average of 15 to 20. One of these assets is mispriced relative to the other, and the resolution of the Iran conflict will determine which one.
If the Hormuz closure persists and oil pushes toward $90 to $100, the inflation re-acceleration forces the Fed to consider another hike. Gold suffers further. If, on the other hand, diplomacy resumes (Iran’s Foreign Minister did leave the door open last week), oil collapses, inflation expectations plunge, and the path to rate cuts reopens. That would be explosively bullish for gold.
The Floor Beneath Gold
There is one structural force that has prevented gold from falling even further: central bank buying. Over the past four years, central banks have accumulated an average of 1,000 tonnes of gold annually, up from roughly 500 tonnes per year in the preceding decade. Poland alone has added 64 tonnes year to date, bringing its reserves to 614 tonnes as it targets 700. China has added 25 tonnes, and Uzbekistan and Kazakhstan are also consistent buyers.
This is a different kind of demand. Central banks are not buying gold to trade the Iran conflict or to hedge CPI prints. They are diversifying reserves away from dollar denominated assets over a multi-year horizon. That structural bid creates a floor under prices that the macro headwinds cannot easily break, which is why gold has held above $3,975 despite everything working against it on the cyclical side.
The tension between these two forces (cyclical headwinds from rising real yields versus structural support from central bank accumulation) is what makes gold such a fascinating asset to watch right now. It also explains why the price action has been so choppy since April: neither side has enough conviction to establish a sustained trend.
What I Am Watching
The most important variable is not gold or oil in isolation. It is the 10 year TIPS yield. If real yields break above 2.40%, gold is heading back toward $3,800 to $3,900 regardless of how many tonnes central banks are buying. If real yields roll over toward 2.00% (which would likely require a diplomatic breakthrough or a sharp slowdown in US data), gold has room to recover toward $4,400 to $4,500 before hitting the next layer of resistance.
Risk Warning: Trading financial instruments, particularly those involving leverage, involves a substantial degree of risk and is not appropriate for all investors. The value of your investments can rise or fall sharply, and it is possible to lose the entirety of your invested capital. Do not trade with funds you cannot afford to lose. Nothing in this site should be read or construed as constituting advice on the part of Taurex or any of its affiliates, directors, officers or employees.