
Key Points
- Bitcoin is trading at $63,676 after bouncing from the $62,800 demand zone, but three bear RSI divergences at the recent highs suggest the recovery is running out of momentum. The $64,000 to $64,200 area is where the chart structure expects sellers to step back in, with targets at $63,200 and $62,800.
- The DAX has rallied over 700 points from 25,500 to 26,250 since last Wednesday, but five bear RSI divergences have formed at the highs. That is the strongest divergence cluster on any chart this week. The 26,200 to 26,300 zone is where the rally is most vulnerable, with demand below at 26,000 and 25,800.
- USD/CAD has recovered from the 1.39900 lows back to 1.40526 but is running into supply between 1.40700 and 1.40800, with four bear RSI divergences flagging that the rally is exhausting. Friday brings both US Non Farm Payrolls (forecast 88K) and Canadian employment data (forecast 15.0K), making this pair the most event driven setup of the three.
Trade 1: Bitcoin Short from Supply
| Pair | Direction | Entry Zone | Target 1 | Target 2 | Invalidation |
| BTC/USD | Short | $64,000 to $64,200 | $63,200 | $62,800 | Above $64,600 |
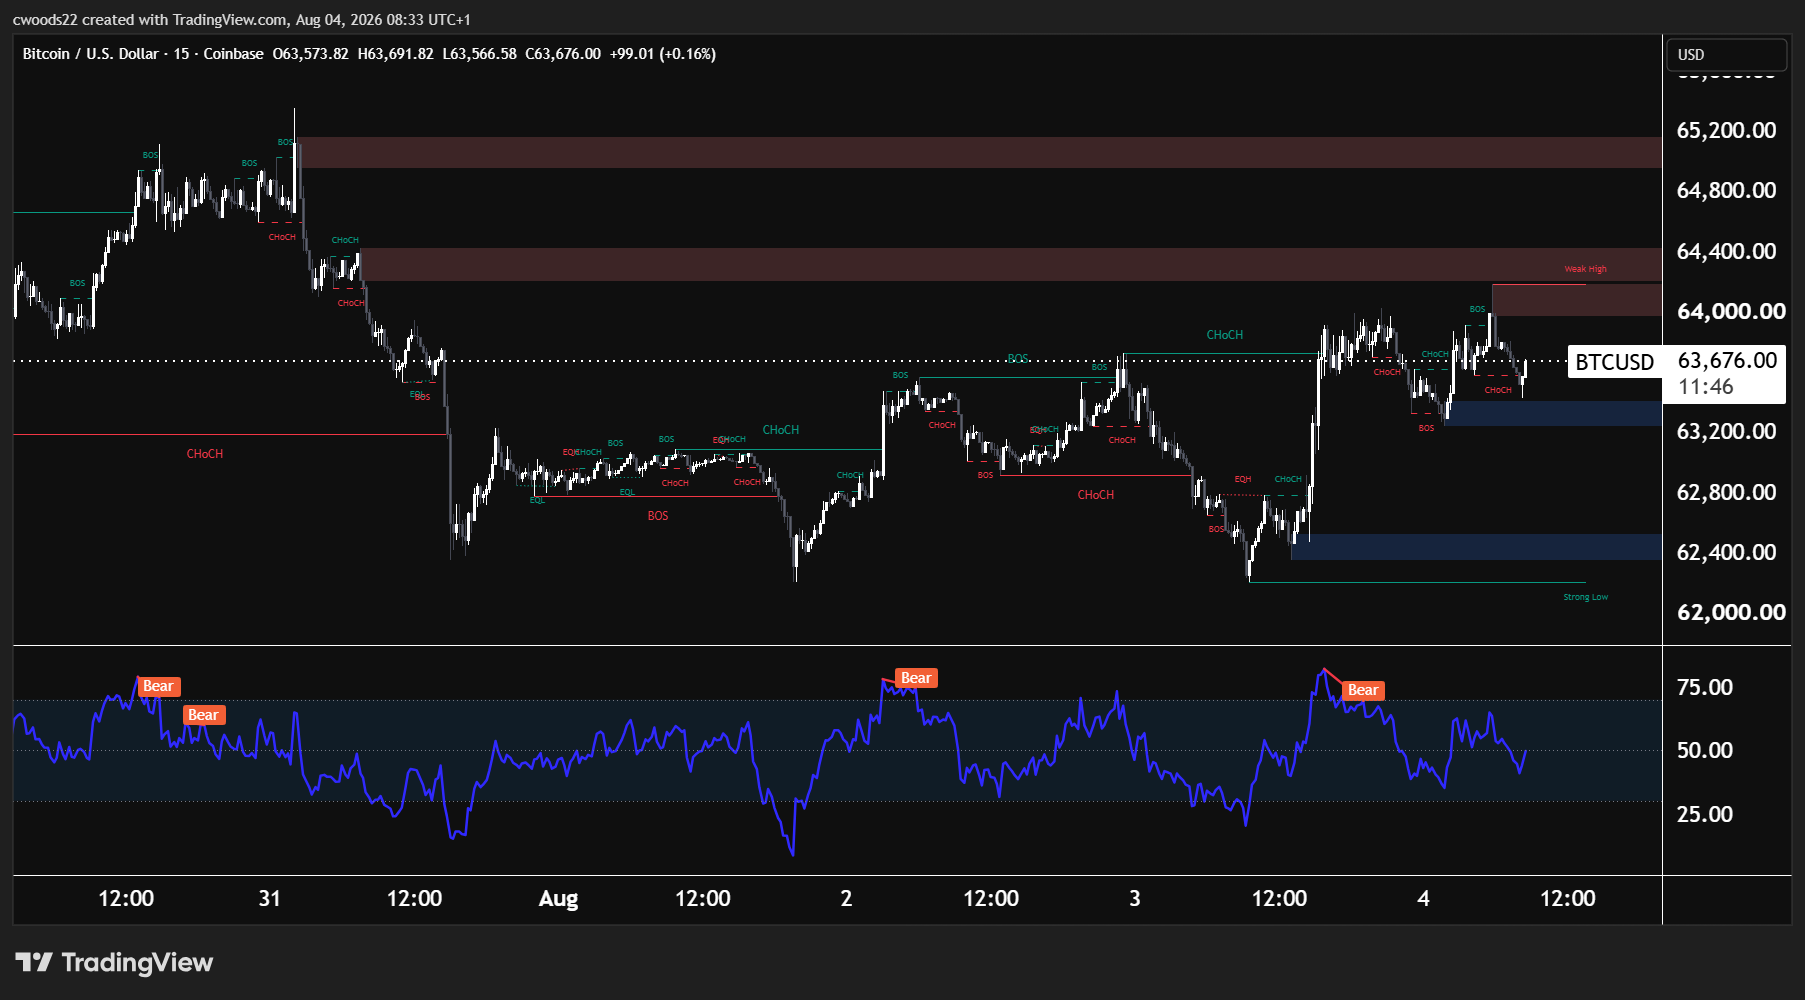
Chart: BTC/USD, 15min timeframe (TradingView, SMC)
Bitcoin has been choppy since the FOMC decision last week. The sell off from $65,200 to $62,800 was sharp and fast, driven by broader risk-off sentiment after the Fed’s hawkish 9 to 3 hold. The bounce from the $62,800 demand zone has been constructive, with price recovering through a series of bullish structural shifts back above $63,600.
The problem is momentum. Three bear RSI divergences have formed at the recent highs, meaning each push higher has come on weaker buying pressure. This is a classic signal that a move is running out of steam. The $64,000 to $64,200 area is the level where the chart structure suggests sellers are most likely to step back in. Price has tagged this zone on multiple occasions this week and been rejected each time.
The supply zone between $64,600 and $65,200 represents the area where the July sell off began. That is the overhead ceiling. On the downside, the demand zone at $62,400 to $62,800 is where buyers stepped in to halt the decline. The first target at $63,200 represents the mid range level where structural support previously broke, and the second target at $62,800 takes price back to the demand floor.
Bitcoin’s correlation with risk assets means that this week’s US labour market data matters. A weak NFP on Friday would reinforce the risk-off tone and support the short case. A strong number could trigger a broader risk rally and invalidate the setup above $64,600.
Trade 2: DAX (GER40) Short from Extended Highs
| Pair | Direction | Entry Zone | Target 1 | Target 2 | Invalidation |
| GER40 | Short | 26,200 to 26,300 | 26,000 | 25,800 | Above 26,350 |
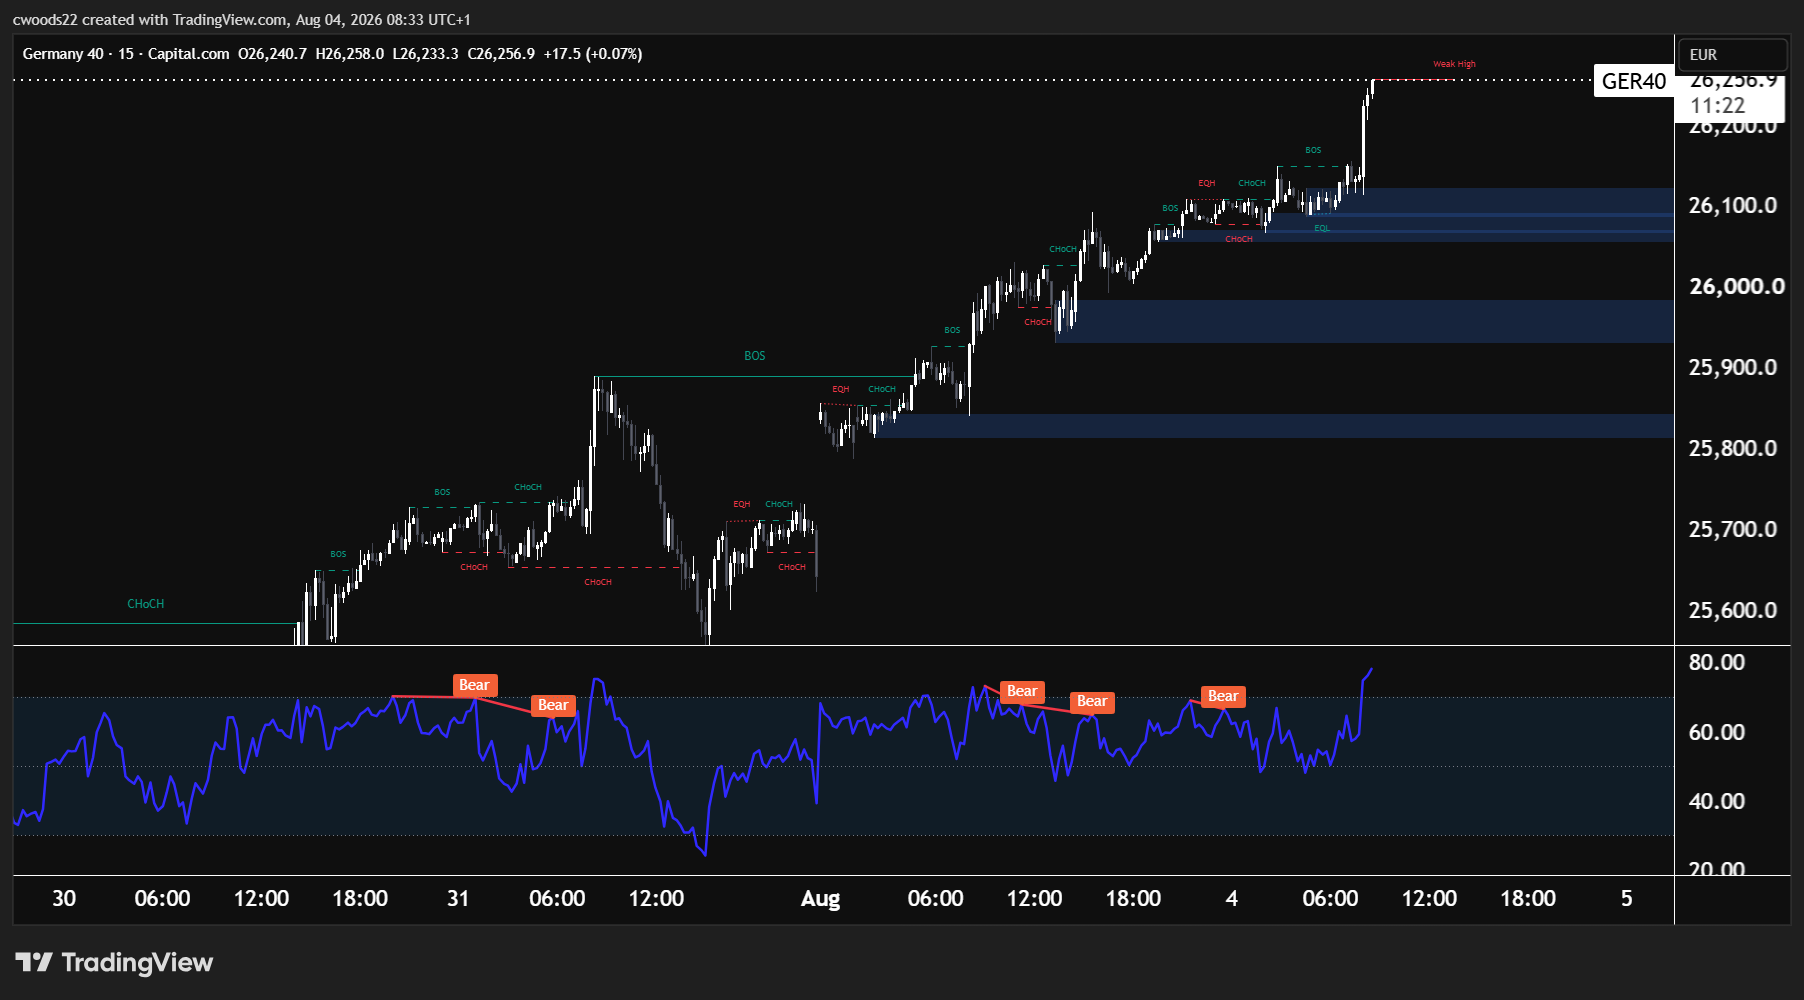
Chart: DAX (GER40), 15min timeframe (TradingView, SMC)
The DAX has had an extraordinary rally over the past four sessions, climbing over 700 points from 25,500 on Wednesday to 26,256 this morning. The move has been driven by a combination of post FOMC positioning, strong European earnings, and a rotation into European equities as US tech came under pressure.
The bullish structure is clear on the 15 minute chart. A change of character bullish at 25,500 marked the low, followed by a series of break of structure signals that drove price through 25,800, 26,000, and into the current area above 26,200. Demand zones are stacked at 26,000 to 26,100 and 25,800, providing support if price pulls back.
However, the RSI tells a very different story. Five bear divergences have formed across the rally from late July to today. That is the most concentrated cluster of bearish divergence on any chart this week, and it is a significant warning signal. Each new high in the DAX has been accompanied by a lower high in the RSI, meaning buying momentum has been steadily fading even as price pushes higher. Extended rallies with this many divergences tend to correct, and the correction often comes sharply.
The 26,200 to 26,300 area is where the rally is most vulnerable. The first target at 26,000 takes price back to the nearest demand zone, and the second target at 25,800 represents the deeper demand level where the post FOMC rally found its base. Invalidation sits above 26,350, where a break would suggest the rally has more room to run despite the divergence warnings.
Trade 3: USD/CAD Short into Friday’s Jobs Data
| Pair | Direction | Entry Zone | Target 1 | Target 2 | Invalidation |
| USD/CAD | Short | 1.40700 to 1.40800 | 1.40200 | 1.40000 | Above 1.41000 |
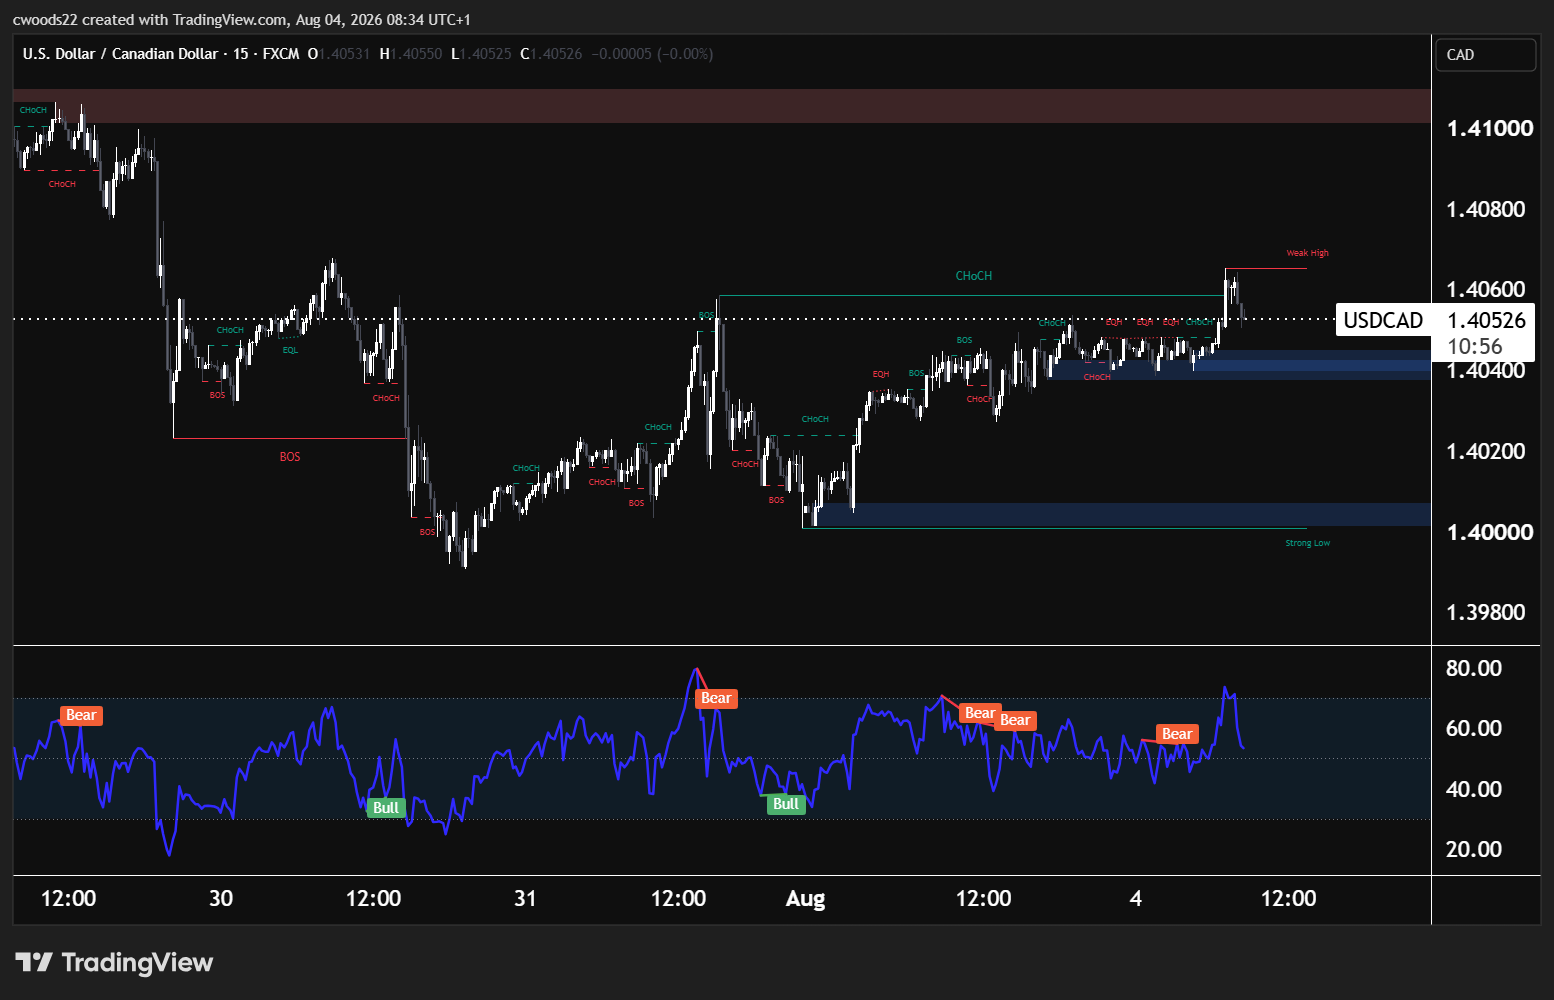
Chart: USD/CAD, 15min timeframe (TradingView, SMC)
USD/CAD is the most fundamentally loaded trade on this week’s radar. The pair sits at 1.40526 after a sharp sell off from 1.41100 to 1.39900 followed by a recovery that has pushed price back into the supply area.
The 15 minute chart shows the journey clearly. The initial drop from 1.41100 was driven by broad dollar weakness after the FOMC decision, with a bearish break of structure confirming the shift in control. Two bull RSI divergences at the lows near 1.39900 and 1.40000 confirmed that selling pressure had exhausted, and the bounce from that demand zone has been steady.
But the rally is now running into resistance. Four bear RSI divergences have formed at the highs, signalling that each push higher is coming on weaker momentum. The supply zone between 1.40700 and 1.40800 has capped the recovery, and the broader supply area extends up to 1.41100 where the sell off began.
Friday is the catalyst. The US releases Non Farm Payrolls (forecast 88K, previous 57K) at 12:30 UTC, and Canada releases its own employment data (forecast 15.0K, previous 18.2K) at exactly the same time. This creates a dual event risk for USD/CAD. If US jobs disappoint while Canadian employment holds up, the US dollar weakens and the Canadian dollar strengthens simultaneously, pushing USD/CAD sharply lower toward the 1.40000 demand zone. If both numbers miss or the US number surprises higher, the setup is invalidated.
The entry zone is 1.40700 to 1.40800, the current supply level where the bear divergences sit. The first target at 1.40200 represents the mid range structural level, and the second target at 1.40000 takes price back to the demand floor. Invalidation above 1.41000 accounts for a full reversal of the bearish setup.
Risk Warning: Trading financial instruments, particularly those involving leverage, involves a substantial degree of risk and is not appropriate for all investors. The value of your investments can rise or fall sharply, and it is possible to lose the entirety of your invested capital. Do not trade with funds you cannot afford to lose. Nothing in this site should be read or construed as constituting advice on the part of Taurex or any of its affiliates, directors, officers or employees.