
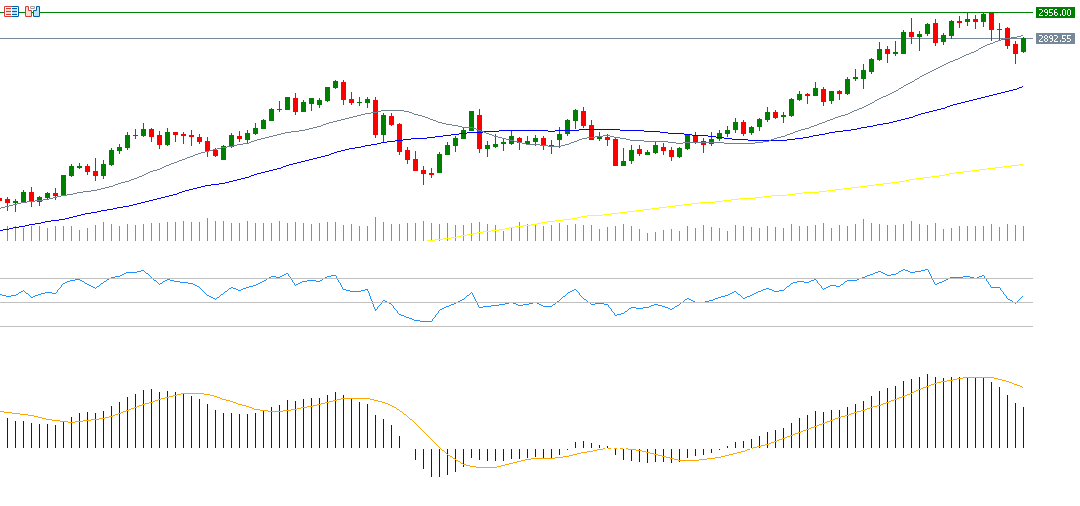
Gold prices reached an all-time high of $2,956 last week before retreating to $2,833 on Friday, February 28, 2025, marking a decline of approximately 4%. This drop is likely due to a correction and profit-taking by investors, which is considered a healthy movement, especially as gold prices approached the highly anticipated psychological barrier of $3,000. However, today, gold prices have rebounded, hovering around the $2,900 level. The key challenge now is to break through the $2,900 resistance level.
Gold prices have risen by approximately 10% since the beginning of the year, outperforming high-risk assets such as Bitcoin and major U.S. stock indices like the S&P 500 and Nasdaq 100. This indicates growing investor concerns, prompting them to seek refuge in the traditional safe-haven asset—gold.
Fundamental factors suggest that gold prices may continue to rise in the coming period for several reasons:
- High U.S. Inflation: Inflation in the United States remains persistent and stubborn. As widely recognized, gold is a hedge against inflation.
- Trade Tensions: The ongoing trade war under the Trump administration has heightened uncertainty, pushing investors toward safe-haven assets. For instance, Trump imposed tariffs of 25% on Mexico and Canada, an additional 10% on China, which took effect today, and threatened the European Union with a 25% tariff.
- Central Bank Purchases: Global central banks, particularly the People’s Bank of China, continue to increase their gold reserves, boosting demand and supporting higher prices.
- Market Expectations for U.S. Interest Rate Cuts: The market anticipates two or three interest rate cuts by the Federal Reserve this year, providing a positive catalyst for gold, which does not yield any returns. Lower interest rates enhance gold’s attractiveness.
- Gold Scarcity: There are 7.2 billion ounces of gold globally, with an additional 2 billion ounces still underground.
The Relative Strength Index (RSI) currently stands at 56 points, reflecting positive momentum for gold. Meanwhile, the MACD indicator shows a bearish crossover between the MACD line and the Signal Line, supporting a continued downward trend for gold.
Please note that this analysis is provided for informational purposes only and should not be considered as investment advice. All trading involves risk.


