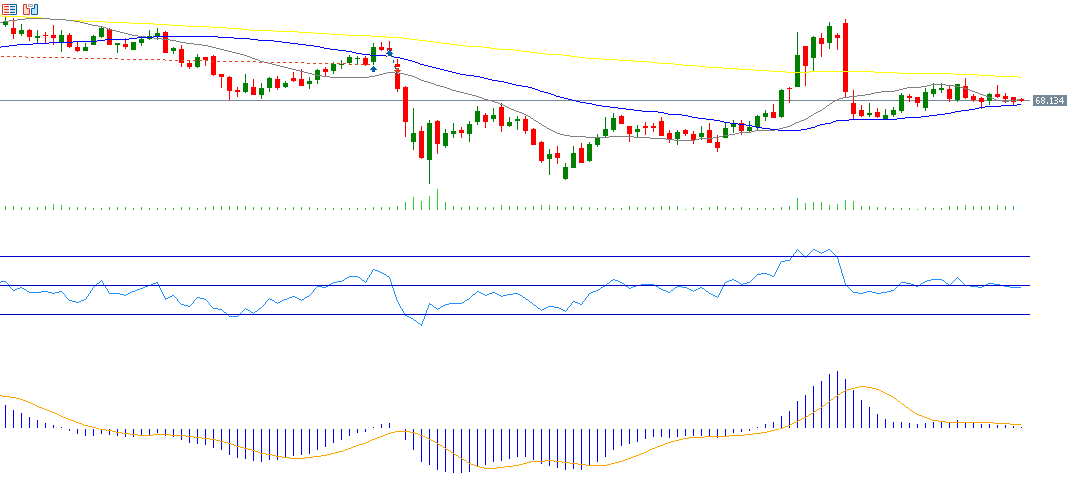
Crude oil prices have been trading in a sideways range between $66 and $71 per barrel over the past month, currently hovering around $68. This horizontal trend is expected to persist, particularly in light of prevailing uncertainty in the oil market, which remains influenced by a mix of opposing factors. Since the beginning of the year, oil prices have declined by approximately 8%.
The main bearish factors weighing on oil prices include:
- Ongoing uncertainty surrounding trade negotiations between the Trump administration and other nations, most notably the European Union. President Donald Trump has threatened to impose 30% tariffs on most EU exports, with the tariffs set to take effect on August 1. This has increased uncertainty, especially amid a lack of comprehensive trade agreements between the U.S. and its global partners, raising concerns about future global demand.
- Comfort on the supply side after the EU announced that the ban on importing refined fuel from Russian oil will not come into effect until January 21, 2026.
- Further relief on the supply front as the OPEC+ alliance begins to ease production restrictions. Data released on Monday showed that Saudi Arabia’s crude oil exports in May rose to their highest level in three months.
From a technical perspective, crude oil prices are currently trading above a key support level—the 50-day moving average (blue line) at $67.59—and also above the second support, the 20-day moving average (grey line) at $68.16. The “Golden Cross” (the upward crossover between the 50-day and 20-day moving averages) is still in place, but the next key challenge lies in whether this positive crossover will turn into a “Death Cross,” confirming a bearish trend in the near term.
As for the Relative Strength Index (RSI), it is currently at 48, indicating a bearish momentum for oil prices. Additionally, a bearish crossover has occurred between the MACD line (blue) and the Signal line (orange), reinforcing the ongoing negative momentum.
The next challenge lies in whether oil prices can remain above the 50-day and 20-day moving averages in an attempt to reach the key resistance level, the 200-day moving average (yellow line), which stands at $70.83.
Please note that this analysis is provided for informational purposes only and should not be considered as investment advice. All trading involves risk.


