
TRIX Indicator Trading Strategy: Signals, Settings, and Forex Setups
Trading Forex can feel frustrating when indicators give too many false signals, especially in sideways markets. The TRIX indicator was designed to address that problem by smoothing price movements and focusing more on real market momentum than on short-term noise.
In this guide, we will explain what the TRIX indicator is, how it works, the signals it gives, trading strategies you can try on Forex trading platforms, and some of the most common mistakes traders make when using it.
What is TRIX Indicator in Trading?
The TRIX indicator, short for Triple Exponential Average, is a momentum indicator that measures the rate of change of a triple smoothed moving average. It was created by Jack Hutson in the early 1980s. The name comes from the words “triple” and “exponential.”
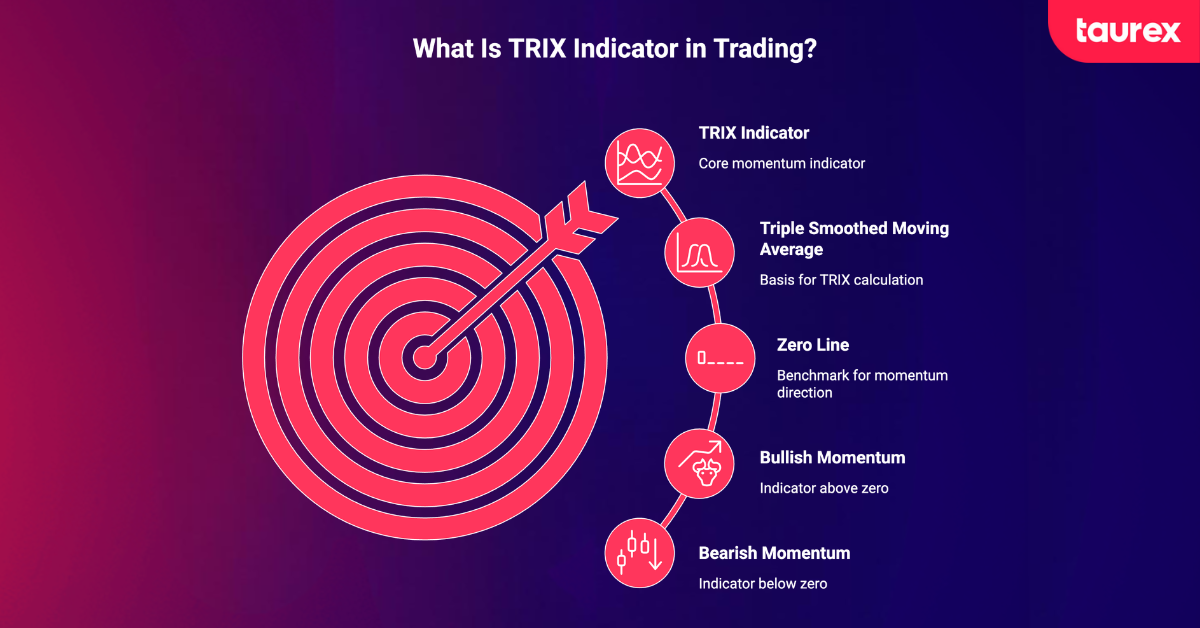
On a trading chart, the TRIX indicator appears in a separate window below the price chart and moves above and below a zero line. When the indicator is above zero, it usually shows bullish momentum because the smoothed average is moving higher. When it is below zero, it suggests bearish momentum because the average is moving lower.
Traders use the TRIX indicator to measure both momentum and trend direction. One of its main advantages is that the extra smoothing helps filter out small price movements and market noise that often create false signals with other indicators. At the same time, TRIX can still react early enough to highlight possible trend changes before they become obvious on the chart.
Why Forex Traders Use The TRIX Indicator
Forex markets can move very quickly because of economic news, central bank updates, and changes in trading volume during different market sessions. This often creates short-term price swings that make many indicators unreliable. The TRIX indicator is popular because its triple smoothing helps reduce this market noise and makes real trends easier to spot.
Another reason traders like TRIX is that it is simple to understand, especially for those who already use indicators like Moving Average Convergence Divergence. The signals and crossover setups work in a similar way, so the learning process feels more familiar. Traders can also use the TRIX indicator on major Forex pairs like EUR/USD, GBP/USD, and USD/JPY across different timeframes, from short-term intraday charts to longer-term weekly charts.
How To Calculate TRIX: A Step-By-Step Guide
The TRIX indicator is calculated in several steps, but trading platforms do all the calculations automatically. In most cases, traders only need to choose the period setting. Still, understanding the process can help explain why the indicator is effective at filtering market noise.
Here is how the TRIX indicator formula calculation works:
- EMA1 = Calculate the n-period EMA of closing prices.
- EMA2 = Calculate the n-period EMA of EMA1.
- EMA3 = Calculate the n-period EMA of EMA2 (this is the triple-smoothed EMA).
- TRIX = ((EMA3 today minus EMA3 yesterday) / EMA3 yesterday) x 100
The default setting is often 14 periods, although traders may adjust it depending on their strategy and timeframe. Shorter settings react faster to price changes, while longer settings produce smoother signals with fewer false moves.
The reason TRIX works differently from many other indicators is because of the triple smoothing process. Each layer removes more short-term price fluctuations, leaving a clearer view of the main market direction. When the TRIX value is above zero, it shows rising momentum. When it is below zero, it suggests falling momentum.
How to Read the TRIX Indicator
The TRIX indicator gives several types of trading signals that help traders understand trend direction and market momentum. Once you learn how to read these signals, TRIX becomes much easier to use in real trading conditions.

Zero-Line Crossovers
One of the most common TRIX signals is the zero line crossover. When the TRIX line moves from below zero to above zero, it usually shows that bullish momentum is getting stronger and may signal a buying opportunity.
When it moves from above zero to below zero, it suggests growing bearish momentum and a possible selling opportunity. This logic mirrors the MACD centreline crossover that most technical analysis practitioners are already familiar with.
These signals are often more useful after the market has been moving sideways or during a possible trend reversal because they help confirm that momentum has changed direction.
Signal Line Crossovers
Many traders also add a signal line to the TRIX indicator, which is usually a moving average of the TRIX line itself. When the TRIX line crosses above the signal line, it creates a bullish signal. When it crosses below the signal line, it creates a bearish signal.
Signal line crossovers happen more often than zero line crossovers. This can help traders enter trades earlier, but it can also lead to more false signals when the market is not trending clearly.
Bullish and Bearish Divergences
Divergence trading is another important way traders use the TRIX indicator. A bullish divergence happens when the price makes lower lows while the TRIX indicator forms higher lows. This can suggest that selling momentum is weakening and that the market may reverse higher.
A bearish divergence happens when the price makes higher highs while the TRIX indicator forms lower highs. This may show that buying momentum is slowing down, and the upward trend could weaken.
However, divergence alone should not be treated as a full trading signal. Many traders wait for confirmation from price action, such as a breakout above resistance or a break below support, before entering a trade.
Spotting Momentum Shifts with TRIX
Traders also watch the direction and slope of the TRIX line to understand market momentum. If the TRIX line is still above zero but starts flattening, it can mean bullish momentum is slowing down. If the line is rising sharply, it usually shows strong momentum behind the trend.
Looking at the slope together with the position of the TRIX line can help traders spot possible momentum changes before a crossover signal appears.
TRIX Indicator Trading Strategies for Forex Traders
The TRIX indicator trading strategy can be applied in different ways depending on your trading style and timeframe. Many Forex traders combine the TRIX indicator with other tools to improve confirmation and reduce false signals.
Trend-Following TRIX Strategy
One of the simplest TRIX indicator trading strategies is the zero line trend following approach. Since the TRIX indicator formula is designed to smooth price action and measure momentum changes, traders look for buying opportunities when the TRIX line crosses above zero, which suggests bullish momentum is building. Selling opportunities appear when the TRIX line crosses below zero, showing bearish momentum.
Many traders close buy trades when the TRIX line starts turning back down toward zero. For sell trades, exits are often considered when the line begins moving higher again. This strategy usually works better on higher timeframes like H4 and Daily charts because the signals are generally more reliable and less affected by market noise.
TRIX + Moving Average Confirmation Strategy
Some traders prefer using TRIX together with moving averages for extra confirmation. A common setup uses the 50 EMA and 200 EMA on the main price chart.
A bullish setup appears when the 50 EMA moves above the 200 EMA while the TRIX indicator is also above zero. A bearish setup appears when the 50 EMA moves below the 200 EMA while TRIX stays below zero. Both conditions should be present before entering a trade.
This combination helps filter out weaker setups and is commonly used on H4 and Daily charts. You can also test this strategy on demo accounts through our platforms before using it in live market conditions.
TRIX Divergence Strategy
Another popular strategy is trading divergence between price and the TRIX indicator. Traders first look for bullish or bearish divergence and then wait for price confirmation before entering a trade.
For example, a bullish setup may be confirmed when the price breaks above a resistance level after bullish divergence appears. A bearish setup may be confirmed when the price breaks below support after bearish divergence forms.
Stop losses are often placed below recent lows for buy trades or above recent highs for sell trades. Many traders also aim for a risk-to-reward ratio where the potential profit is at least twice the possible loss.
Best Timeframes for TRIX Trading
The TRIX indicator trading strategy can be used on many timeframes, but different settings work better for different trading styles.
Scalpers often use lower timeframes with faster settings for quicker signals. Day traders commonly use medium timeframes with standard settings, while swing traders usually prefer higher timeframes and slower settings for smoother signals.
Many traders also use a multi-timeframe approach.
For example, they may check the main trend on the Daily chart and then look for entries on the H1 or H4 chart. In general, TRIX tends to perform better on timeframes above 30 minutes because there is enough price data to filter out short-term market noise more effectively.
Understanding Forex market hours can also help you identify the sessions with the strongest trending behaviour.
Best TRIX Indicator Settings for Trading Forex
Choosing the right TRIX settings can make a big difference in how reliable your signals are. There is no single perfect setup, but there are common starting points that most traders use and then adjust based on their strategy.
Common Default Settings
Most trading platforms use a TRIX setting around 14 or 15 periods with a 9-period signal line. This is often written as TRIX (15, 9). Some platforms use 18 as a default period. The 15-period setting is widely used as a standard reference.
These default settings are a good starting point, but traders usually test them on different pairs and timeframes to see what works best for their approach.
Faster vs Slower TRIX Settings
| Style | Period | Characteristics |
| Scalping/Day Trading | 8 to 12 | More sensitive, more signals, more noise |
| Standard (Default) | 14 to 15 | Balanced noise filtering and responsiveness |
| Swing Trading | 18 to 21+ | Fewer signals, smoother, better for strong trends |
Shorter periods can help you catch moves early, but they also increase noise. Longer periods reduce false signals but may enter trades later. The best choice depends on your trading style and should always be tested before use.
Which Currency Pairs Work Best with TRIX?
The TRIX indicator generally works best on major Forex pairs that have strong liquidity and clear trends. Examples include EUR/USD, GBP/USD, USD/JPY, and AUD/USD.
It tends to perform poorly in sideways or low-volatility Forex conditions, regardless of which pair you trade. Because of this, avoiding choppy market phases is just as important as choosing the right currency pair.
How Forex Traders Use the THV TRIX Indicator on MT4
The THV TRIX indicator is a full trading system built around a modified version of the TRIX indicator.
Unlike the standard TRIX indicator, the THV version uses two lines, a fast line and a slow line. These lines are color-coded to make trend direction easier to see. When both lines turn green, it suggests bullish momentum. When both turn red, it suggests bearish momentum.
Traders usually look for entries when the price moves in the same direction as the colored TRIX signals. A stronger confirmation appears when the fast line crosses the zero level while both lines agree on direction. Exits often happen when the fast line changes color or when the price reaches a key support or resistance level.
To install the system on MT4, traders download the THV TRIX indicator file, place it in the indicators folder, and add the template file to the templates folder. After restarting MT4, the template can be applied directly to a chart. It is worth noting that standard TRIX is not included by default in MT4, so a custom installation is required. In contrast, MetaTrader 5 includes TRIX as a built-in indicator under the oscillators section.
Advantages and Limitations of the TRIX Indicator in Forex Trading
The TRIX indicator trading strategy has several strengths that make it useful for Forex traders, but it also has clear limitations that are important to understand before using it in live trading.
Advantages: TRIX is good at filtering out market noise because it uses triple smoothing, which helps traders focus on the main trend instead of small price movements. It can also show momentum changes through zero line crossovers, signal line crossovers, and divergence, giving multiple ways to read the market. In addition, it is flexible and can be adjusted for different trading styles and timeframes.
Limitations: TRIX is still based on moving averages, so it reacts to price changes with some delay. It can also give many false signals in sideways markets where prices move without a clear trend. Finally, its settings need to be tested for each market, as there is no one perfect setup for all pairs and timeframes.
TRIX vs MACD: Key Differences between These Indicators
If you already use MACD and are thinking about TRIX, the main difference comes down to speed versus smoothness. TRIX filters more noise, while MACD reacts faster to price changes.
Moving Average Convergence Divergence is generally more reactive, while TRIX is smoother and slower. TRIX tends to move later because it uses heavier smoothing.
| Feature | TRIX | MACD |
| Smoothing | Triple exponential | Single exponential (12 and 26 EMA) |
| Output | Smoother, less jagged | More reactive, jaggier |
| Signal Timing | Turns a bit later | Turns faster |
| Signal Types | Zero crossover, signal line crossover, divergence | Same three |
| Noise Filtering | Superior | Good but less filtered |
Both indicators can produce similar types of signals, especially when using common settings like TRIX (15,9) and MACD (12,26,9). When both agree on the same direction, it can strengthen the quality of a trading setup.
TRIX is better when you want cleaner signals and less market noise. MACD is better when you prefer faster reactions and earlier entries, even if that means more false signals.
Common Mistakes Traders Make When Using TRIX
Even though the TRIX indicator can be a powerful tool, many traders use it incorrectly and end up with weak or inconsistent results. Most of these issues come from treating it as a standalone system instead of part of a broader trading strategy.
Below are some of the most common mistakes traders should avoid:
- Trading TRIX alone without combining it with at least one confirmation tool, such as an EMA, RSI, or key support and resistance levels.
- Using default settings without testing them against your specific pair and timeframe, since what performs well on GBP/USD may not work on USD/JPY.
- Trading in ranging markets where TRIX whipsaws constantly as the EMAs overlap with no meaningful directional movement.
- Ignoring higher timeframe context, such as taking a bullish TRIX signal on M15 when the Daily trend is clearly bearish.
- Misreading divergences by comparing highs on price to lows on the indicator, or failing to align swing points vertically on the chart.
- Skipping risk management on divergence trades often leads to oversized positions based on overconfidence in the reversal signal.
- Not backtesting custom settings before applying them live, since pair-specific optimisation is a non-negotiable part of using TRIX effectively.
Final Thoughts
The TRIX indicator is a helpful tool for Forex traders who want to reduce noisy and unreliable signals from standard indicators. Its triple smoothing helps clean up price action, making trends easier to see compared to simpler moving average-based tools. It also offers different types of signals, which give traders more ways to interpret the market.
However, TRIX works best when it is used in the right conditions and with proper settings. It should also be combined with other confirmation tools to improve accuracy. Whether you are using the standard version or the THV TRIX on MT4, the main idea stays the same: test your approach, follow the trend, and manage risk carefully.
If you want to practice these strategies without risk, you can open a demo account on Taurex and test TRIX setups in real market conditions before trading live.
FAQ
What does the TRIX indicator measure?
TRIX measures the 1-period percentage rate of change of a triple exponentially smoothed moving average. It reveals both the direction and strength of price momentum while filtering out short-term market noise that typically generates false signals on simpler oscillators.
Is the TRIX indicator good for Forex trading?
Yes. TRIX is particularly well-suited for Forex because of its superior noise-filtering capability. It works best on trending currency pairs and higher timeframes, where its triple-smoothed signals provide clearer directional cues than standard momentum tools. It can be applied to any pair and any timeframe from intraday to weekly.
Why does the TRIX formula help filter market noise?
Each layer of exponential smoothing eliminates shorter-cycle fluctuations. By the third EMA, only price movements that persist longer than the chosen period remain visible in the indicator output. This is why a 15-period TRIX, for example, suppresses all cycles shorter than 15 bars, making the remaining signals far more reliable.
What is the best TRIX setting for Forex?
There is no universally best setting. The most widely used starting point is a 14 to 15-period with a 9-period signal line. Day traders tend to use 8 to 12 for more sensitivity, while swing traders prefer 18 to 21+ for smoother, more reliable signals. Backtesting on your specific pair and timeframe is the only way to find your optimal configuration.
What is the difference between TRIX and MACD?
TRIX uses triple exponential smoothing and displays the percentage rate of change of that smoothed output. MACD uses single exponential smoothing and measures the difference between two EMAs. TRIX produces smoother, less reactive signals that turn a bit later, while MACD is faster and more sensitive to short-term price changes.
Does TRIX repaint?
The standard TRIX indicator and the TRIX Crossover MT4/MT5 indicator do not repaint. Signals are confirmed on bar close. Some multi-timeframe variants may appear to repaint because they reference higher-timeframe bars that are still forming, but this is a rendering issue rather than true signal repainting.
Can beginners use the TRIX indicator?
Yes, with the right approach. The core signal logic of zero line crossovers, signal line crossovers, and divergence is straightforward. Beginners should start with default settings on a demo account, combine TRIX with a moving average for confirmation, and avoid trading during choppy, sideways market conditions where the indicator generates unreliable signals.
Is THV TRIX available for MT4?
Yes. THV TRIX V6.01 is a free custom indicator for MT4 that must be manually installed into the platform’s indicators folder. It is not a built-in MT4 indicator, but it is widely available for download from Forex trading communities and forums.
How does THV TRIX differ from standard TRIX?
THV TRIX uses two colour-coded TRIX lines (fast and slow) rather than a single line. It integrates with the broader THV trading system, which includes Ichimoku-style clouds and other overlays for a more complete signal framework. The colour-coding provides instant visual confirmation of trend direction, with green for bullish and red for bearish conditions.
Is THV TRIX good for scalping?
THV TRIX was originally designed for trend-following rather than pure scalping. The TRIX Crossover indicator (a related MT4/MT5 tool) is noted as effective for intraday trading and scalping, with optimal timeframes of M1 to M30 and faster period settings in the 8 to 12 range.