
Ethereum — the world’s second-largest cryptocurrency by market capitalization (around $519 million) after Bitcoin — reached $4,366 yesterday, its highest level since December 9, 2021. Prices have surged about 215% from the April 7 low of roughly $1,383 to yesterday’s peak of $4,366. Since the start of the year, Ethereum has gained about 30% and is currently trading near $4,300.
Key factors supporting Ethereum’s price include — but are not limited to — the following:
- Ongoing investment inflows into Ethereum-linked exchange-traded funds (ETFs).
- Trump signing an order directing regulators to allow retirement and savings plans, such as 401(k) plans, to invest in alternative assets and private equity, including cryptocurrencies.
- Continued investment inflows into cryptocurrency products.
- Increased risk appetite among investors, particularly large institutions, which are adding Ethereum to their portfolios for diversification and on growing optimism about the cryptocurrency sector.
It is worth noting that when comparing Ethereum’s performance to Bitcoin at present, Ethereum has outperformed since January 6, 2025, thanks to institutional inflows into Ethereum-linked ETFs, which recorded around $6 billion in inflows during July alone. Expectations point to these inflows continuing in the coming period. The main challenge for Ethereum is to break the $4,350 resistance level, after which it could aim for its all-time high of $4,868, recorded on November 10, 2021.
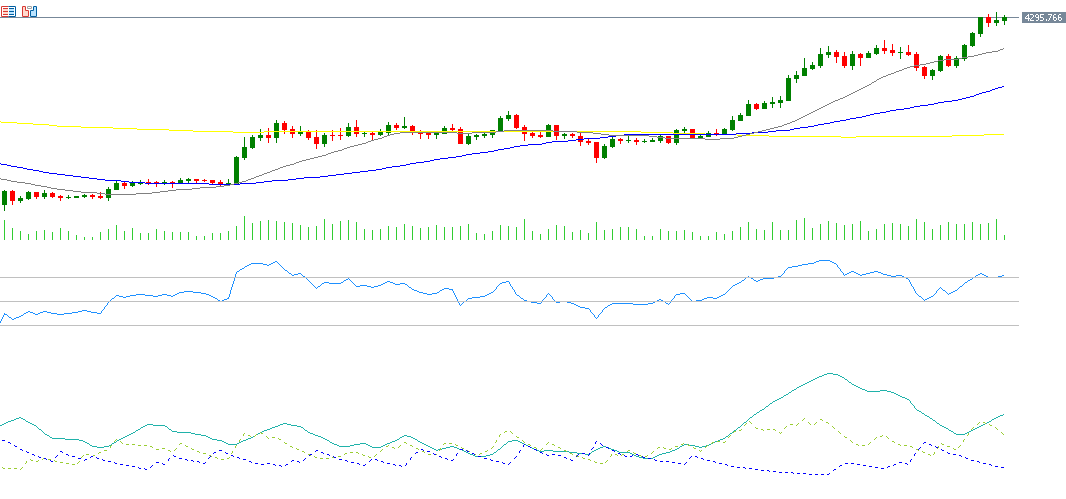
From a technical perspective, indicators point to the continuation of Ethereum’s uptrend for the following reasons:
- Alignment of the 20-, 50-, and 200-day moving averages in a bullish formation — the 20-day average is above the 50-day, and the 50-day is above the 200-day.
- The Relative Strength Index (RSI) is currently at 73, in overbought territory, reflecting strong bullish momentum.
- The Positive Directional Movement Index (DMI+) is around 35, compared to the Negative Directional Movement Index (DMI-) at around 9 — a wide gap indicating strong buying pressure. More importantly, the Average Directional Index (ADX) is around 44, signaling that the strength of this uptrend is robust.
Please note that this analysis is provided for informational purposes only and should not be considered as investment advice. All trading involves risk.


