
The French CAC40 index continues its upward momentum, closing at 8,314 points yesterday — its highest level on record. The index has surged by about 23% since the low recorded on April 7, 2025, at 6,764 points, reaching yesterday’s peak of 8,314 points. It has also gained around 12% year-to-date.
The notable rise in the CAC40 index can be attributed to several key factors:
• The signing of the U.S. government spending bill by President Donald Trump, ending the longest government shutdown in U.S. history, which lasted 43 days and boosted investor sentiment toward risk assets.
• Market expectations of a 25-basis-point rate cut by the U.S. Federal Reserve at its December 10 meeting, with a probability of around 60%, also added positive momentum to equity markets.
• Stronger-than-expected French economic data, such as GDP growth of 0.5% in the third quarter (above expectations of 0.2%), and an increase in the monthly industrial production index by 0.8%, also exceeding forecasts (0.1%) and the previous reading (-0.9%).
• Attractive valuations of French equities compared with U.S. stocks, such as those in the S&P 500.
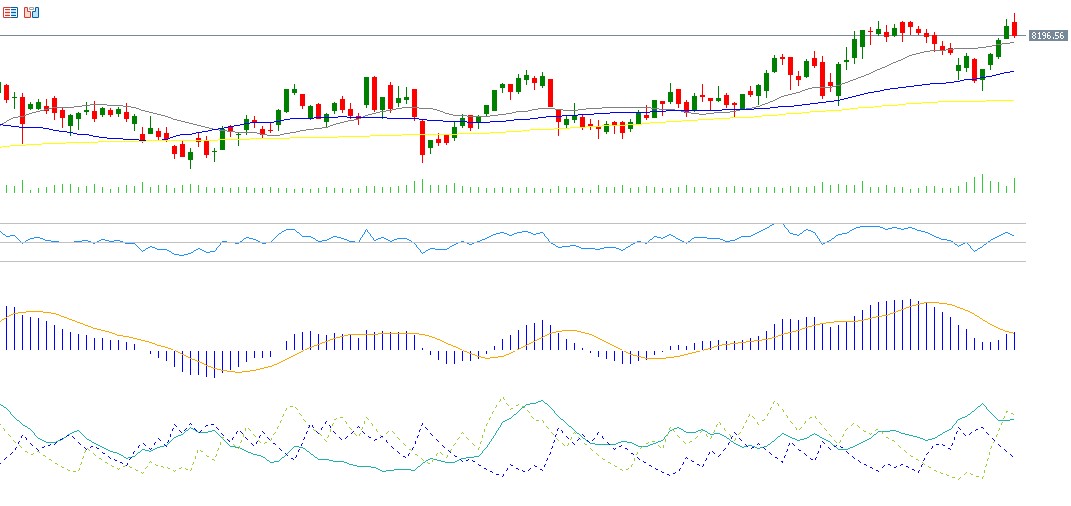
From a technical standpoint, indicators support the continuation of the CAC40’s upward trend for the following reasons:
• Alignment and upward direction of the 20-, 50-, and 200-day moving averages, with the 20-day average above the 50-day, and the 50-day above the 200-day average.
• The Relative Strength Index (RSI) currently stands at 63, reflecting strong bullish momentum.
• The MACD indicator shows a bullish crossover between the blue MACD line and the orange signal line, reinforcing positive momentum in the CAC40.
• The Positive Directional Movement Index (DMI+) is around 33, compared with the Negative Directional Movement Index (DMI-) at about 23. The wide gap between these two indicators highlights strong buying pressure on the index.
Please note that this analysis is provided for informational purposes only and should not be considered as investment advice. All trading involves risk.