
Key Points
- Netflix reports after the US close today, with Meta and Tesla following on Wednesday, as the Nasdaq 100 fades from a Monday rebound high, gold slips with the 10-year yield above 5.1%, and oil holds near the top of a three-week climb on Gulf supply risks.
- The Nasdaq 100 is trading at 29,426.6, faded from a Monday high near 29,775 and now below the 29,630 to 29,775 supply zone, with Friday’s low near 29,050 the level below.
- Gold is trading at $4,142.24, bouncing from an overnight low near $4,115 after rejection at the $4,172 to $4,190 supply zone, with a December Fed hike priced at close to 90%.
- WTI crude is trading at $98.75, just under Monday’s high near $99.65, after climbing through higher lows from $86.80 on 6 October, with Brent near $110 on claimed Houthi attacks on Saudi energy sites.
Nasdaq 100: Fading Into Supply Ahead of Netflix
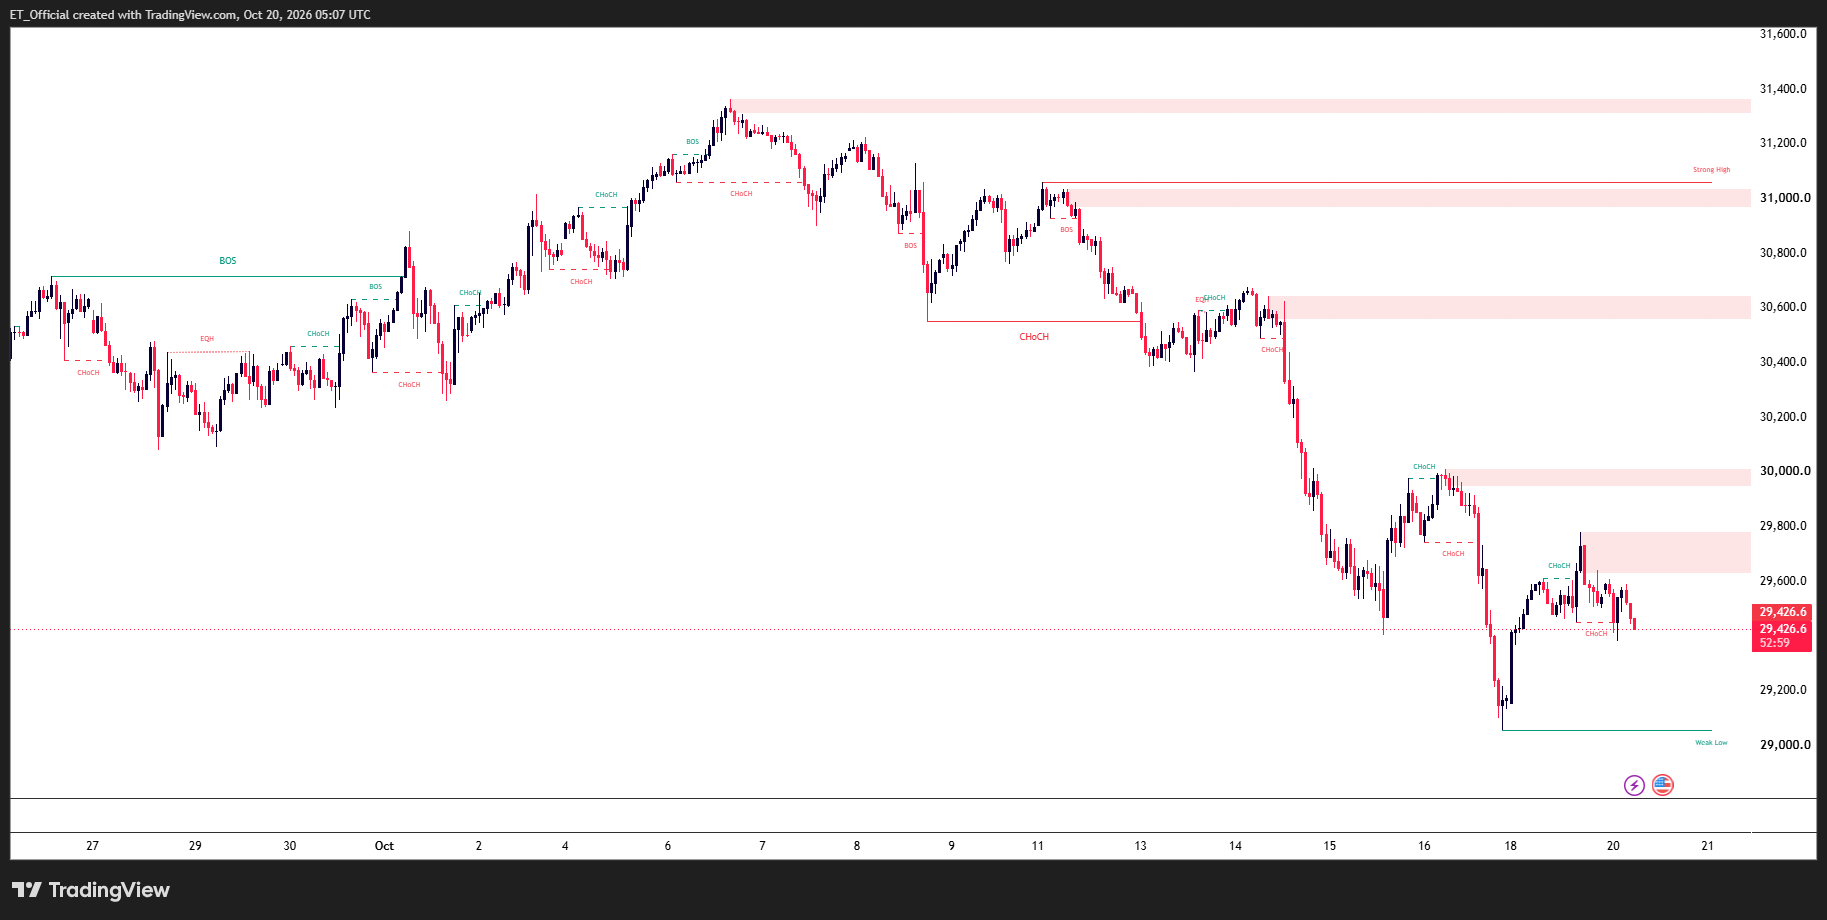
Chart: Nasdaq 100 (US100), H1 timeframe (TradingView, SMC)
Nasdaq 100 (US100) H1 chart, 26 September to 20 October 2026: price rallied to a high near 31,350 on 6 October, fell to a low near 29,050 on 16 October, rebounded to a Monday high near 29,775, and is now trading at 29,426.6 below the 29,630 to 29,775 supply zone.
The H1 chart shows a clean sequence of lower highs since the 6 October high near 31,350, with supply zones at 30,970 to 31,030 and 30,560 to 30,640 rejecting each rally on the way down to Friday’s low near 29,050. The rebound since then has been shallow, reaching a Monday high near 29,775 before rolling over into the 29,630 to 29,775 supply zone.
Price is now at 29,426.6, fading from that high even though the Nasdaq Composite closed 1.1% higher on Monday as chips ended an eight-session losing streak. The 29,380 to 29,410 area, where the 15 October low and Monday night’s low sit, is the near-term floor to watch.
A reclaim of 29,775 would open 29,945 to 30,005, where the late-last-week relief rally was rejected, while a break below the 29,380 floor would bring Friday’s 29,050 low back into play. Netflix reports after the US close tonight, and Meta’s capex guidance on Wednesday is the main read on AI spending.
Gold: Rejected at Supply, Holding Above the Overnight Low
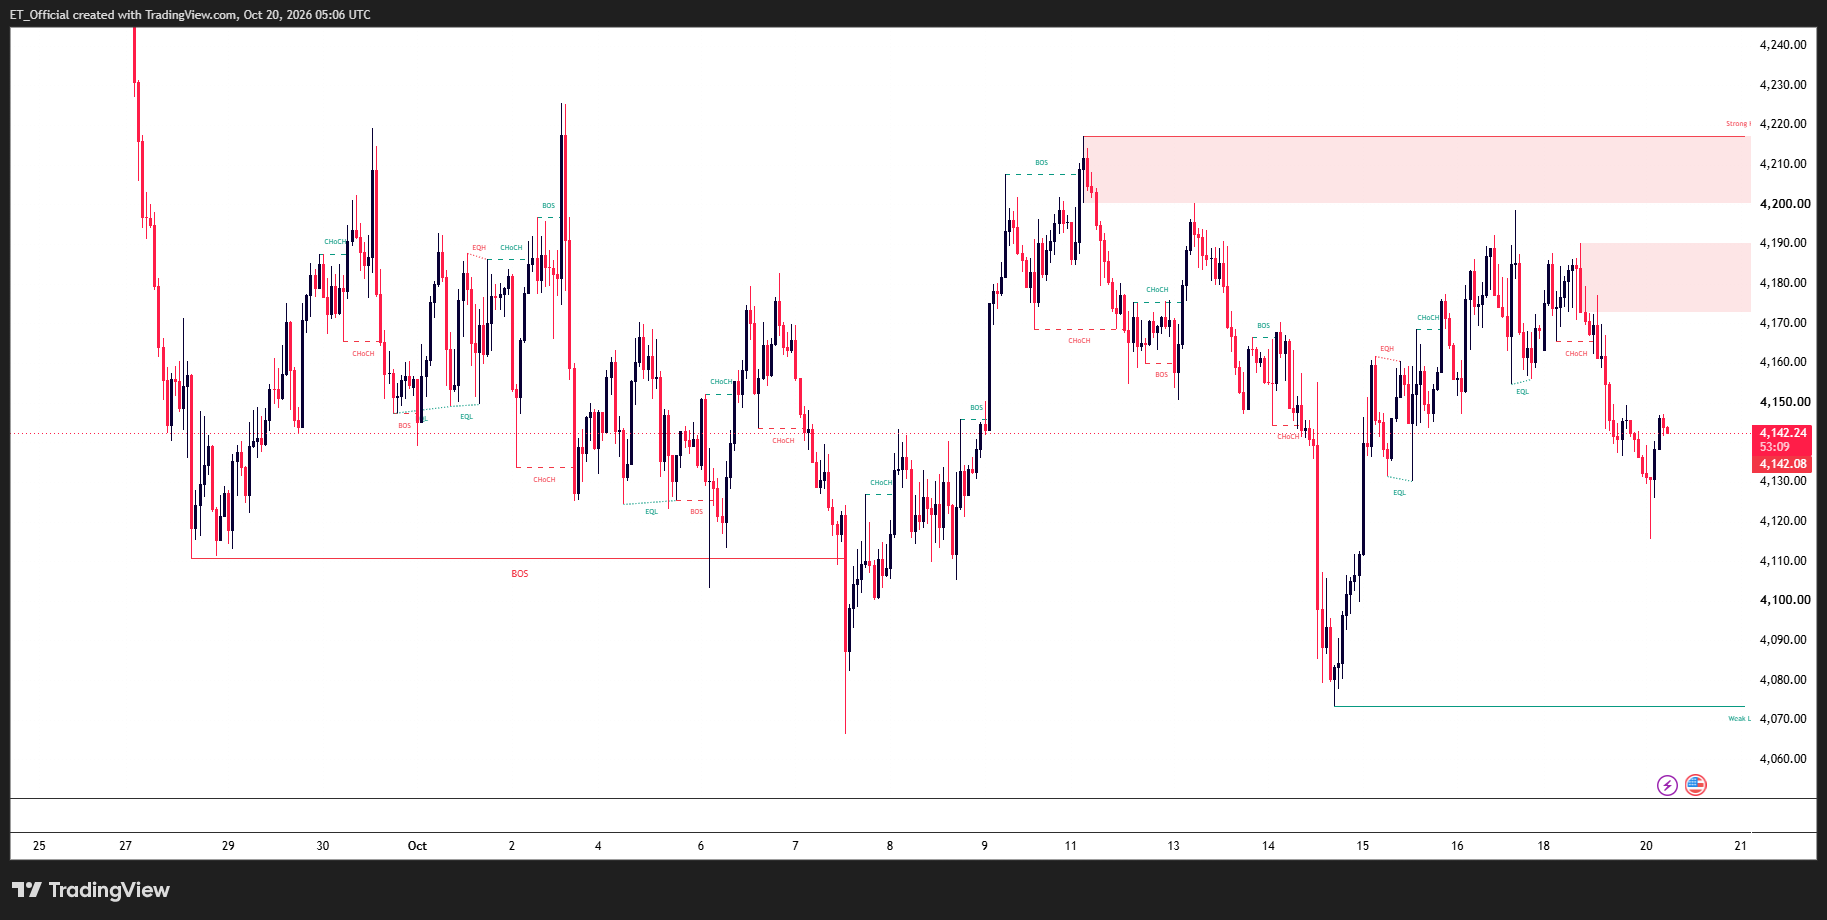
Chart: Gold (XAU/USD), H1 timeframe (TradingView, SMC)
Gold (XAU/USD) H1 chart, 25 September to 20 October 2026: price ranged between 4,065 and 4,225, was rejected at the 4,172 to 4,190 supply zone on Monday, fell to an overnight low near 4,115, and is now trading at 4,142.24.
Gold’s H1 chart shows a market that has ranged between the 4,065 low from 7 October and the 4,225 high from 2 October for three weeks, with the 4,073 low from the 14 October CPI release holding the lower end. The rebound reached a high near 4,198 late last week before failing at the 4,172 to 4,190 supply zone on Monday.
Price fell to an overnight low near 4,115 and is trading at 4,142.24, with the 10-year yield at about 5.14% and the Dollar Index near 102 keeping pressure on. Markets expect a hold at the Fed’s 27 to 28 October meeting but price close to 90% odds of a December hike.
Overhead, 4,172 to 4,190 is the first supply zone, then 4,199 to 4,217, with the 4,225 high above. Below, the 4,115 overnight low is first, then the 4,073 and 4,065 lows. Metals Focus sees a floor near $4,000 and calls the pullback competition for capital from the tech rebound rather than lost appeal.
WTI Crude: Higher Lows Into Expiry Day
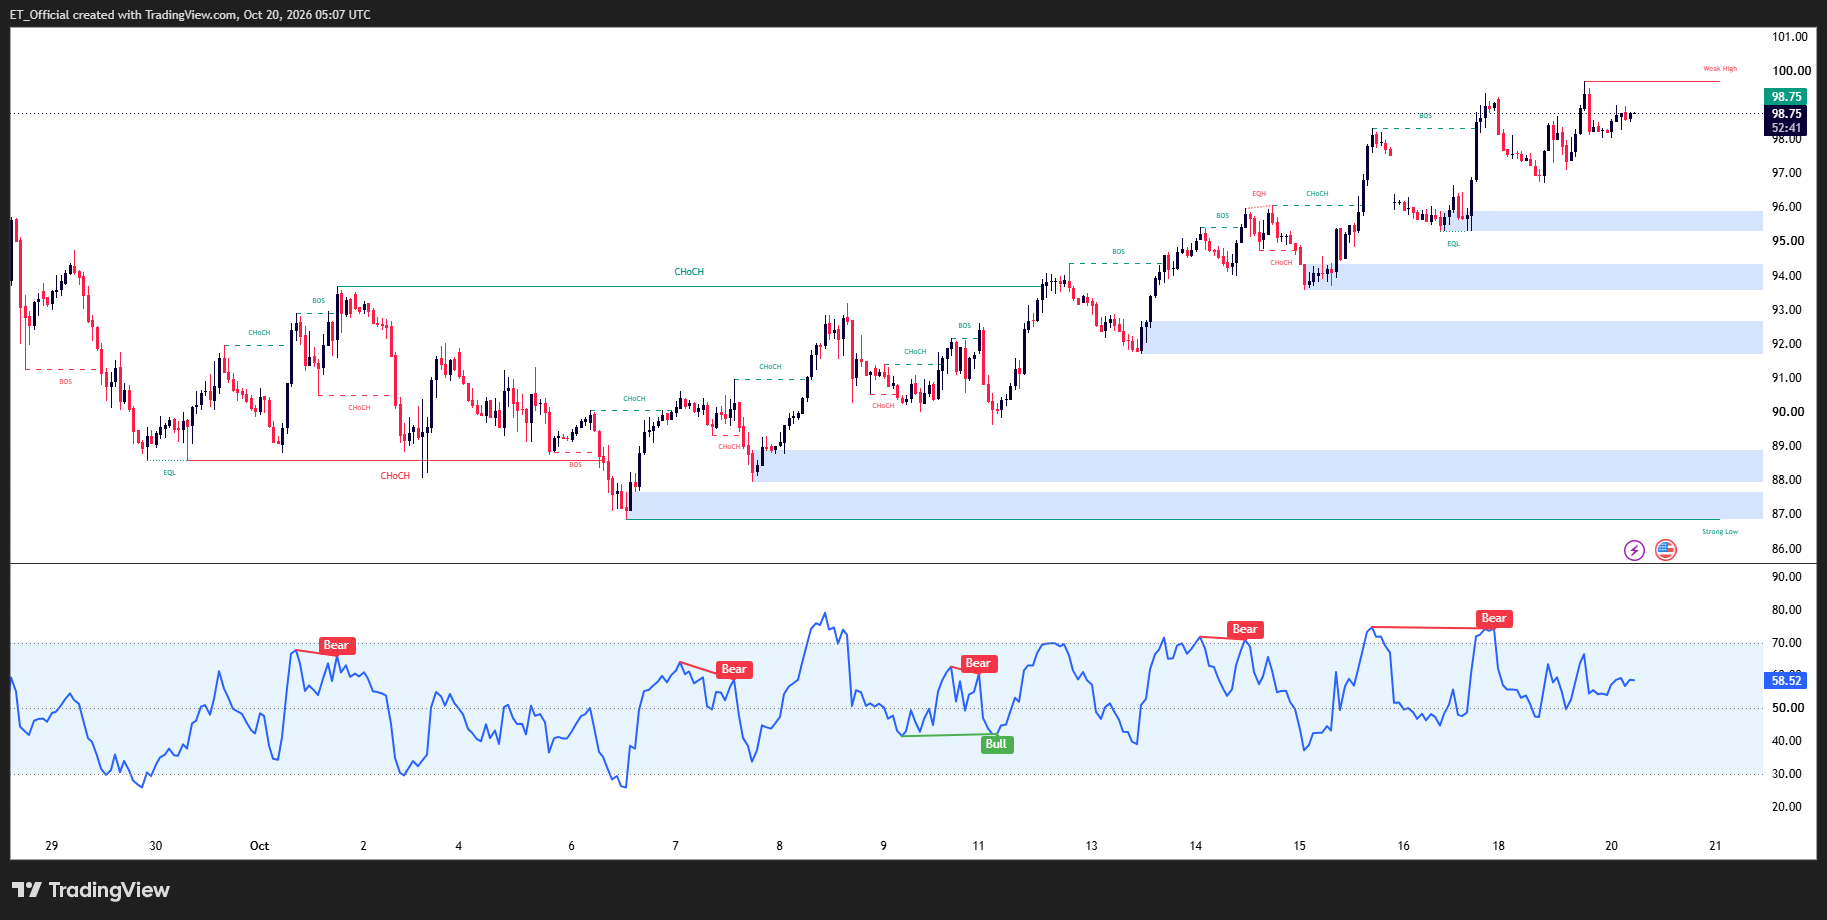
Chart: WTI Crude Oil, H1 timeframe with RSI (TradingView, SMC)
WTI crude oil H1 chart with RSI, 28 September to 20 October 2026: price climbed through higher lows from 86.80 on 6 October to a high near 99.65 on 19 October, and is now trading at 98.75 with RSI at 58.52.
WTI’s H1 chart shows a staircase of higher lows from 86.80 on 6 October to 96.70 on Monday, with demand zones at 86.80 to 87.60, 87.90 to 88.80, 91.70 to 92.60, 93.40 to 94.20 and 95.20 to 95.80 each holding on the way up. Price reached 99.65 on Monday and is now at 98.75, consolidating just under that high.
RSI is at 58.52, cooled from above 70, with bearish divergence flagged at several recent highs including the 16 October peak, so momentum is thinner than the price trend suggests. The 95.20 to 95.80 zone is the first level to hold on a pullback, while a clean break above 99.65 would open the 100 area.
The driver is supply risk. Brent is near $110 after touching its highest since May on Monday, following claimed Houthi attacks on Saudi energy sites including Yanbu and Shaybah that Saudi authorities have not confirmed, and Kpler counts at least 18 vessels attacked in two weeks. The Russia sanctions waiver offers some relief, but Trump has said no final decision has been made, and ING says the risk premium would erode only slowly. Today the expiring November contract trades near $103.9, about $5 above the more active December contract on this chart.
Risk Warning: Trading financial instruments, particularly those involving leverage, involves a substantial degree of risk and is not appropriate for all investors. The value of your investments can rise or fall sharply, and it is possible to lose the entirety of your invested capital. Leveraged products, in particular, amplify both potential gains and losses. Before engaging in such trading, you must assess your financial goals, experience level, and appetite for risk. It is your sole responsibility to ensure that you understand the mechanics and risks of trading, including margin requirements, and to seek independent financial advice where appropriate. Do not trade with funds you cannot afford to lose. Nothing in this article constitutes financial advice or a personal recommendation, and nothing in this site should be read or construed as constituting advice on the part of Taurex or any of its affiliates, directors, officers or employees. All levels referenced are for educational and illustrative purposes only.