
The price of gold reached $2,685 on September 26 this year, which is its all-time high. It then dropped to $2,603 on October 10, 2024. It has been trading for the past three weeks and until today in a horizontal range between $2,670 and $2,600 without a clear directional trend, whether upward or downward.
Factors putting pressure on gold prices include, but are not limited to:
- The People’s Bank of China halting its gold purchases for the fifth consecutive month in September, after an 18-month buying spree. This pause is due to the rise in gold prices, according to an official statement from the Chinese central bank.
- The strength of the U.S. dollar index, which measures the dollar’s performance against a basket of six major currencies, driven by stronger-than-expected labor market and inflation data. Additionally, cautious statements from some Federal Reserve members regarding the future of interest rates have added to the pressure. For instance, Neel Kashkari stated that interest rate cuts will be modest in the coming months, while Christopher Waller urged caution in reducing rates at a slower pace. The likelihood of a 50-basis-point rate cut has decreased, with markets currently pricing in an 92% chance of a 25-basis-point cut, and a 8% chance of rates remaining unchanged at the next Federal Reserve meeting on November 7.
Factors supporting gold prices include, but are not limited to:
- Inflation in the United States
Inflation remains stubborn in the U.S., with recent data on core Personal Consumption Expenditure (PCE), Consumer Price Index (CPI), and Producer Price Index (PPI) all surpassing analysts’ expectations on a yearly basis, which supports gold as a hedge against inflation. - Geopolitical tensions
The ongoing geopolitical tensions in the Middle East and the Red Sea, as well as any potential expansion of the current war, could positively impact gold prices, given its status as the traditional safe haven. - Central bank gold purchases
Central banks continue to buy gold. However, the key question remains: Will the People’s Bank of China resume its gold purchases in the coming phase?
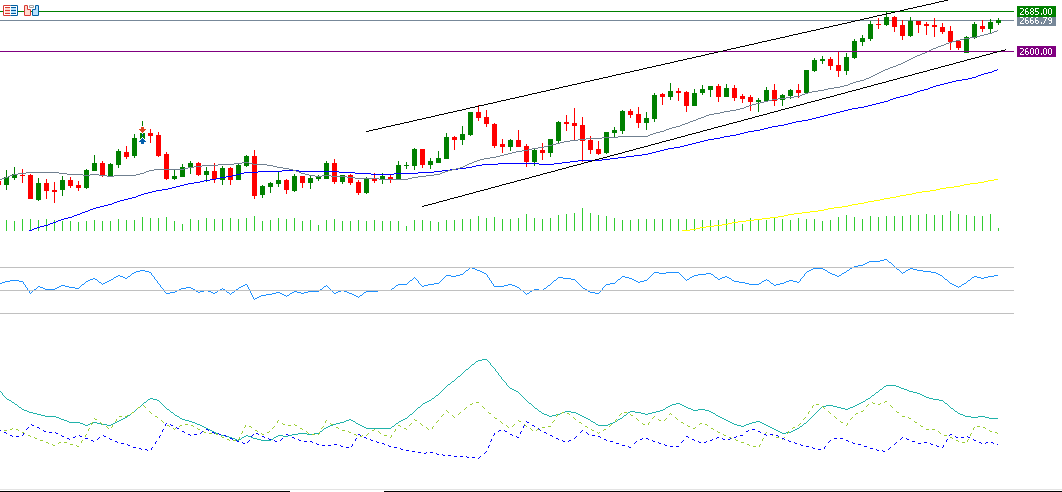
From a technical perspective, it seems that the indicators support the continued rise in gold prices for the following reasons:
- The alignment of the 20, 50, and 200-day moving averages and their upward trend, with the 20-day moving average surpassing the 50-day moving average, and the 50-day moving average surpassing the 200-day moving average.
- The Relative Strength Index (RSI) is currently at 63 points, indicating upward momentum for gold.
- The Positive Directional Index (DMI+) is registering around 24 points, while the Negative Directional Index (DMI-) is at approximately 14 points. The considerable gap between these two indicators suggests that buying pressure on gold is adequate.
It is worth noting that any upward break of the $2,670 resistance level could likely lead to reaching the psychological barrier of $2,700, with the next target potentially being the $2,800 level. On the other hand, if the price breaks downward through the $2,600 support level, there is a possibility of a decline toward the $2,500 support level.
Please note that this analysis is provided for informational purposes only and should not be considered as investment advice. All trading involves risk.


