
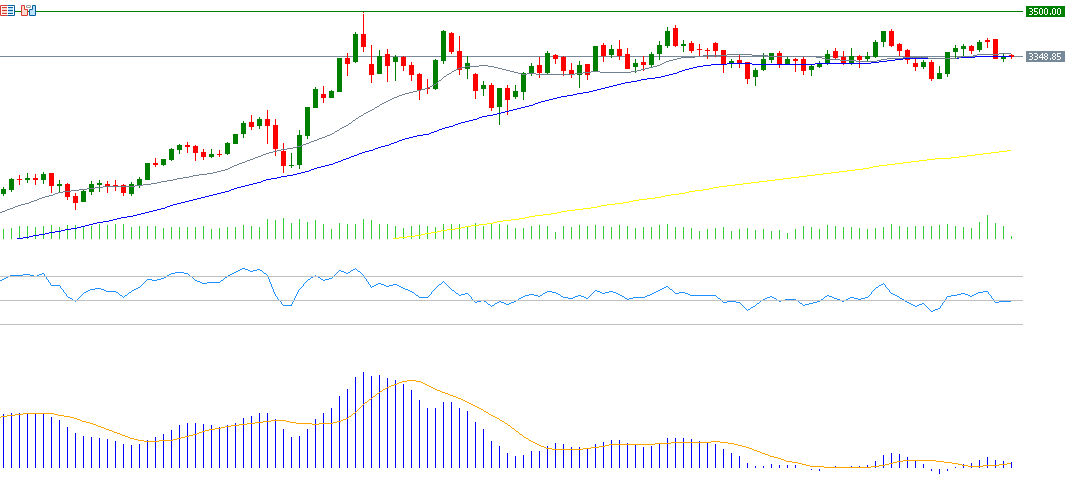
Gold prices fell yesterday to $3,331, their lowest level since August 1, 2025, before closing at $3,348. Since hitting an all-time high of $3,500 on April 22, 2025, prices have been trading sideways within a horizontal range between strong support at $3,200 and strong resistance at $3,400, searching for a clear direction either upward or downward. Nevertheless, the yellow metal remains up about 27% year-to-date, outperforming high-risk assets such as U.S. stock indices.
It appears there are currently factors pressuring gold prices, most notably:
- The continued easing of trade tensions between the United States and China, especially after the extension of tariff suspensions on China for 90 days until November 10, along with a possible visit by U.S. President Donald Trump to meet Chinese President Xi Jinping in the near future.
- The upcoming summit scheduled for Friday in Alaska between Trump and Russian President Vladimir Putin to discuss finding a solution to end the Russia–Ukraine war.
In contrast, there are factors supporting gold prices, most notably:
- Ongoing gold purchases by central banks, led by the People’s Bank of China, which continues to increase its gold reserves, boosting demand and supporting prices.
- Continued weakness in the U.S. dollar index.
- Expectations of three U.S. interest rate cuts this year, which would provide upward momentum for gold as a non-yielding asset.
From a technical perspective, indicators suggest some negative momentum for gold for the following reasons:
- The Relative Strength Index (RSI) is currently at 49 points, reflecting continued bearish momentum.
- A bearish crossover in the MACD indicator has occurred between the blue MACD line and the orange signal line, reinforcing the negative momentum.
- Despite the continued alignment of the 20-, 50-, and 200-day moving averages, gold prices closed below the 20-day moving average at $3,357.
Please note that this analysis is provided for informational purposes only and should not be considered as investment advice. All trading involves risk.