
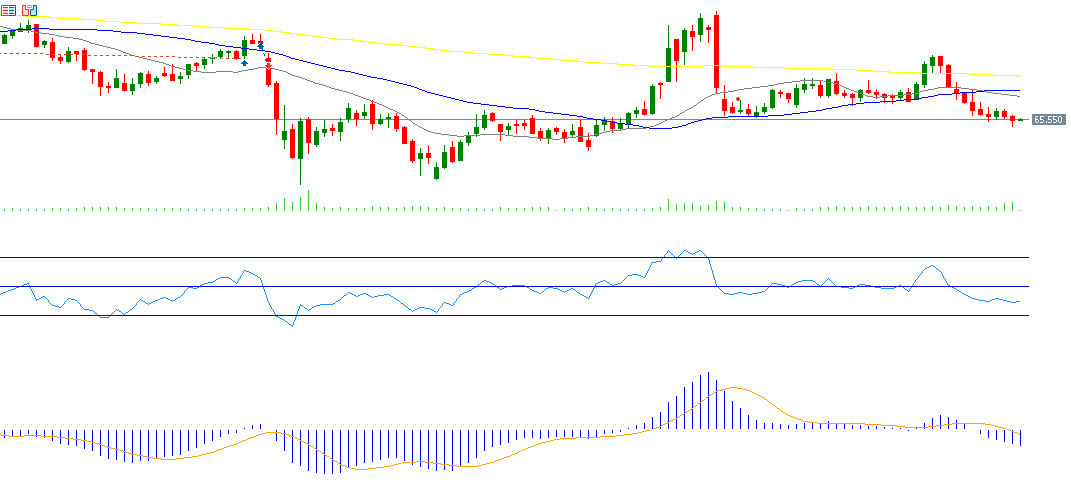
Crude oil prices continued to decline, settling yesterday at $65.01 — their lowest level since June 6, 2025. Prices have fallen by about 10% from the July 30, 2025 peak of $72.80 to yesterday’s low of $65.01. They are also down roughly 12% year-to-date.
Key negative factors weighing on oil prices include:
- Ongoing geopolitical uncertainty, as U.S. President Donald Trump downplayed the chances of a breakthrough in upcoming talks with Russian President Vladimir Putin at Friday’s summit, while Ukrainian President Volodymyr Zelensky rejected any territorial concessions.
- Weak recent economic data from major oil importers such as China and the United States, putting pressure on global oil demand.
- Seasonal demand decline expectations for oil in the coming month of September.
- The end of the “OPEC+” voluntary production cuts of 2.2 million barrels per day.
- A larger-than-expected build in U.S. crude inventories, which rose by 3.036 million barrels last week, compared to forecasts of a 0.900-million-barrel draw, and a previous reading of a 3.029-million-barrel draw.
In its monthly report, OPEC kept its 2025 global oil demand growth forecast unchanged at 1.3 million barrels per day but raised its 2026 growth forecast by 100,000 barrels per day to 1.4 million. It also maintained its forecast for non-OPEC supply growth at 800,000 barrels per day this year while lowering its 2026 forecast to 600,000 barrels per day.
Technical outlook: Crude oil is currently trading below its 200-day, 50-day, and 20-day moving averages, with a bearish “Death Cross” forming between the 20-day and 50-day moving averages — indicating continued downside potential. The Relative Strength Index (RSI) is currently at 37 reflecting bearish momentum. Additionally, the MACD line (blue) is showing a bearish crossover below the signal line (orange), further supporting negative price momentum.
Please note that this analysis is provided for informational purposes only and should not be considered as investment advice. All trading involves risk.