
Despite a strong start in yesterday’s session for U.S. equity indices—driven by Nvidia’s robust earnings, which exceeded expectations for both revenue and profit, along with optimistic forward guidance—markets later reversed and closed in the red. Nvidia’s CEO, Jensen Huang, stated that demand for Blackwell chips is “out of control,” noting that the company’s cloud GPU units are fully sold out. Nevertheless, the major indices, including the S&P 500, Nasdaq 100, Dow Jones, and Russell 2000, all ended the session lower.
At the same time, the volatility and fear index (VIX) witnessed sharp fluctuations. After dropping to 19.28 points at the start of the session, it surged to 28.27, the highest level since October 17, 2025, indicating heightened anxiety and risk aversion among investors. The main driver remains concerns over a potential bubble in highly valued AI-linked tech stocks. The “Magnificent Seven” (MAGS) index fell about 2% yesterday, while the Philadelphia Semiconductor Index (SOX) dropped more than 4%.
Uncertainty surrounding the path of U.S. interest rates continues to be the most significant risk facing markets, especially ahead of the Federal Reserve meeting on December 10. Market expectations have been highly volatile following the release of mixed U.S. labor data for September. Nonfarm payrolls rose by 119,000 jobs, above expectations (53,000) and the prior reading (-4,000)—while the unemployment rate climbed to 4.4%, above both expectations and the previous reading (4.3%), marking the highest level since October 2021. This increased uncertainty has led the market to price in less than a 50% probability of a rate cut in December.
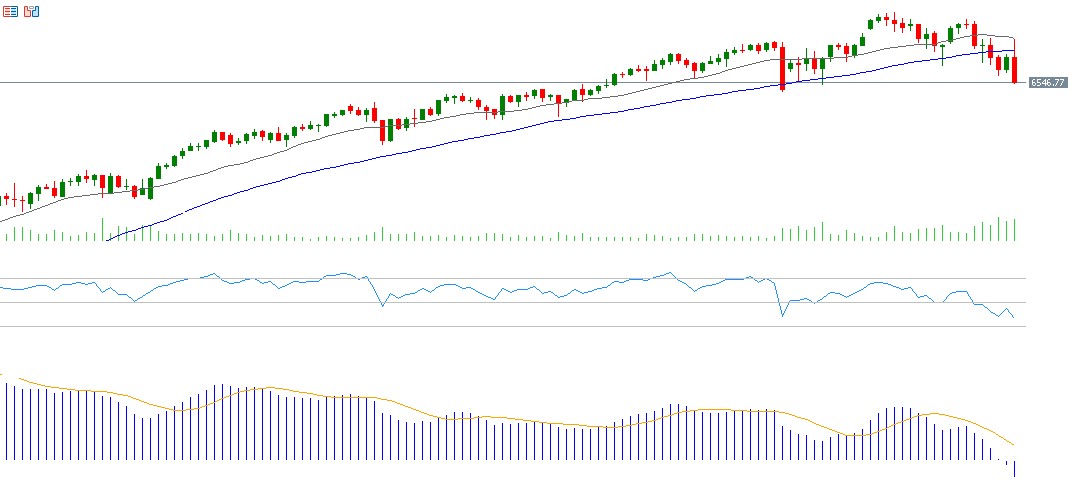
From a technical perspective, the S&P 500 is trading below the 20-day moving average at 6,773 points and below the 50-day moving average at 6,711 points. The next key question is whether the index will test its strategic support at the 200-day moving average near 6,160 points. The Relative Strength Index (RSI) stands at 35, signaling bearish momentum. Additionally, a downward crossover between the MACD line and the signal line within the negative zone confirms ongoing negative momentum.
Please note that this analysis is provided for informational purposes only and should not be considered as investment advice. All trading involves risk.


