
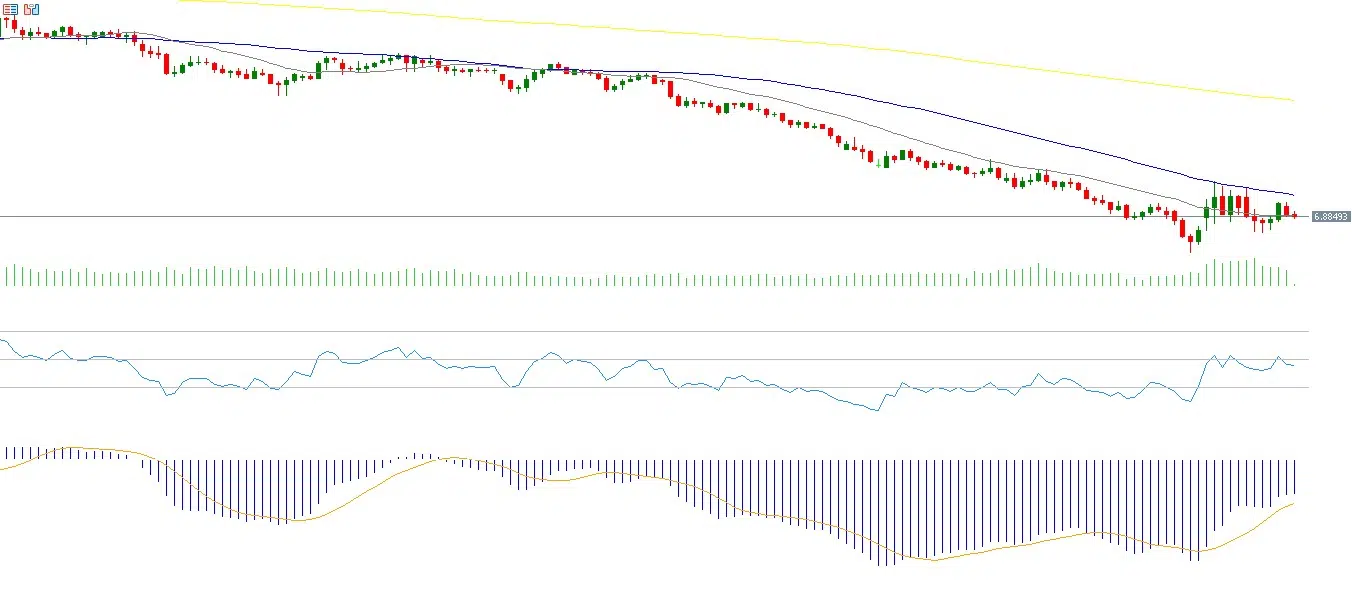
The US dollar against the Chinese yuan has been trading since the beginning of March until today within a horizontal range between 6.8600 and 6.9400, in an attempt to find a clear direction, either upward or downward. The pair has declined by about 1% since the beginning of the year to date.
As for the Hang Seng Index, it has risen by about 2% since the beginning of the year, outperforming US, and European indices. In contrast, the Hang Seng Tech Index has fallen by 6% during the same period, indicating selling pressure on Chinese technology stocks.
Chinese economic data released yesterday showed notable divergence but leaned toward improvement. Retail sales on a yearly basis in February increased by 2.8%, higher than expectations of 2.6% and the previous reading of 0.9%. Fixed asset investment also rose on an annual basis, recording growth of 1.8%, which was higher than expectations of -5.0% and the previous reading of -3.8%. Industrial production also increased on a yearly basis, recording growth of 6.3%, higher than expectations of 5.3% and the previous reading of 5.2%.
On the other hand, housing prices declined on a yearly basis, recording a contraction of 3.2% compared with a contraction of 3.1% in the previous reading, indicating continued pressure on the real estate sector, which has been experiencing disruptions for the fifth consecutive year. The unemployment rate also rose to 5.3%, higher than both expectations and the previous reading of 5.1%.
Markets are also awaiting the anticipated meeting between the US and Chinese presidents at the end of this month in China, amid cautious optimism from both sides.
From a technical perspective, indicators suggest mixed signals regarding the future direction of the US dollar against the Chinese yuan for several reasons. First, there is still a negative alignment in the 20-, 50-, and 200-day moving averages with a downward trend, as the 200-day average is above the 50-day average and the 50-day average is above the 20-day average, indicating continued negative momentum. Second, the Relative Strength Index currently stands around 46, reflecting negative momentum for the pair. Third, in contrast, the MACD indicator shows a bullish crossover between the MACD line and the signal line, supporting the possibility of positive momentum in the coming period.
Please note that this analysis is provided for informational purposes only and should not be considered as investment advice. All trading involves risk.