
CFDs are complex instruments and carry a high risk of rapid losses due to leverage.

Location & Language

Taurex Global Limited regulated by the Financial Services Authority (FSA) of Seychelles (SD092)

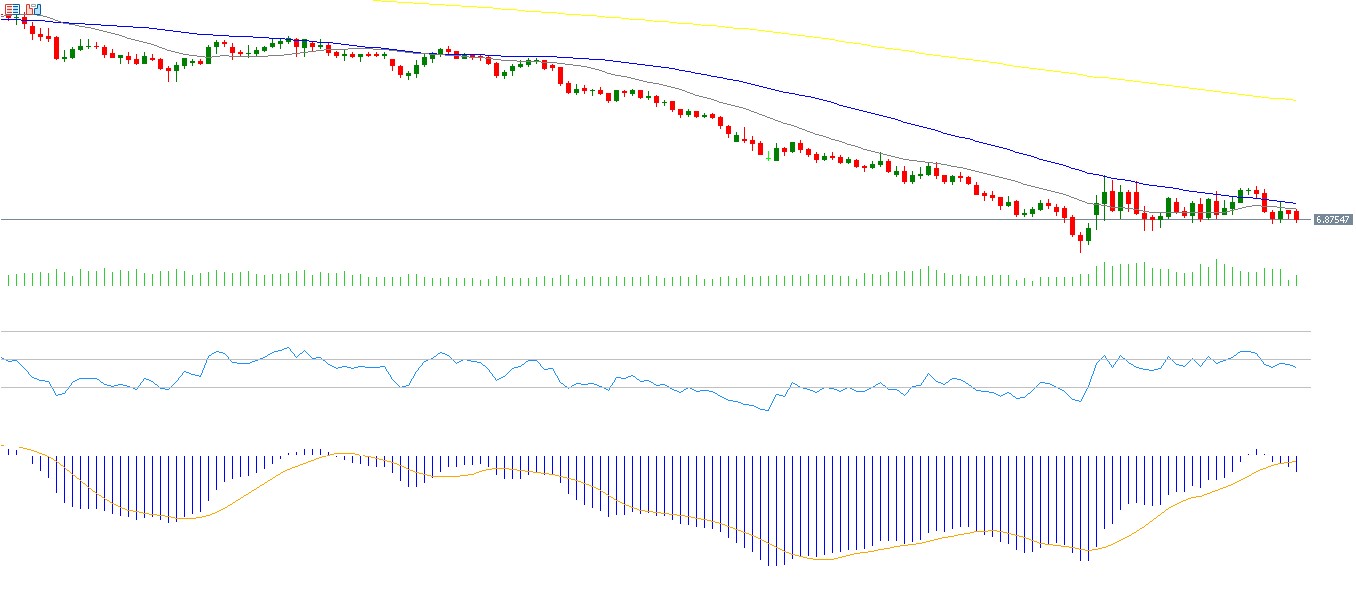
The USD/CNH pair has declined by approximately 1.5% since the beginning of the year, trading sideways

Author:

Taurex

The US dollar against the Chinese yuan has been moving within a horizontal range between 6.8600 and 6.9400 since the beginning of the month, as the market attempts to determine a clear direction, either upward or downward. The pair has dropped by around 1.5% year-to-date.

Meanwhile, the Hang Seng Index has fallen by about 2% since the start of the year. In contrast, the Hang Seng Technology Index has dropped 15% over the same period, indicating selling pressure on Chinese tech stocks.

Recent Chinese economic data have been mixed but generally leaned toward improvement. The official manufacturing PMI rose to 50.4 points, surpassing expectations (50.1) and the previous reading (49.0). The official non-manufacturing PMI also increased to 50.1 points, exceeding expectations (49.9) and the prior reading (49.5). Industrial sector profits in China jumped 15.2% year-on-year in the first two months of 2026, marking a strong recovery compared to 0.6% growth in 2025.

On the other hand, the Caixin manufacturing PMI fell to 50.8 points, below expectations (51.6) and the previous reading (52.1), while the Caixin services PMI dropped to 52.1 points, below expectations (53.6) and the prior reading (56.7).

Markets are looking ahead to the release of China’s consumer and producer price indices on Friday.

From a technical perspective, indicators suggest a negative bias for the USD/CNH pair in the near term for several reasons. First, the 20-, 50-, and 200-day moving averages remain in a bearish alignment, with the 200-day MA above the 50-day, and the 50-day above the 20-day, indicating ongoing downward momentum. Second, the relative strength index (RSI) currently stands at around 44, reflecting bearish momentum. Third, the MACD shows a bearish crossover between the MACD line and the signal line, supporting the likelihood of continued negative pressure on the pair.
Please note that this analysis is provided for informational purposes only and should not be considered as investment advice. All trading involves risk.

Back

Taurex
Taurex brings a new perspective to trading - your confidence is our benchmark.
With a safe and secure trading ecosystem, diverse range of assets, comprehensive education, and advanced trading tools, Taurex empowers you to trade with confidence.

On this page

Ready for more?
Move to Taurex today

Popular Posts

Trade Radar: Nasdaq 100 Fades Into Supply Ahead of Netflix as Gold Slips...

Big Tech Earnings Test a Battered AI Trade as the Nasdaq 100 Slides...

Under the Microscope: Copper Edition

Coffee & Charts: Stocks and Yields Rose Together for Six Months. Now They...

Here are some related articles you may find interesting:

Market Insights​

October 20, 2026

Trade Radar: Nasdaq 100 Fades Into Supply Ahead of Netflix...

Key Points Netflix reports after the US close today, with Meta and Tesla following on Wednesday, as the Nasdaq 100 fades from a Monday rebound...

Market Insights​

October 19, 2026

Big Tech Earnings Test a Battered AI Trade as the...

Key Points Netflix, Meta and Tesla headline a week of earnings that will show whether the AI spending worries behind last week's sell-off are easing,...

Market Insights​

October 16, 2026

Under the Microscope: Copper Edition

Key Points Copper is trading at 6.6168, about 4% below its late-September record near 6.92, after rising close to 60% from the August 2025 low...

Market Insights​

October 15, 2026

Coffee & Charts: Stocks and Yields Rose Together for Six...

Key Points The Nasdaq 100 (US100) and the US 10 year Treasury yield have moved in the same direction for most of 2026, both climbing...

Ready to Elevate Your Trading Journey?

Open a Taurex account and start trading today.

Chat on WhatsApp

1 Hour Trading Consultation