
Key Points
- October US CPI lands at 13:30 UTC today, forecast at +0.3% on the month with core at +0.2%, with December Fed hike odds near 76% to 78%. WTI crude has broken lower on US and Iran headlines, USD/JPY is pinned in a range on its averages, and EUR/USD is pressing into supply.
- WTI crude is trading at 85.03, below the 86.10 change of character level it lost this week, with the 80.30 to 83.00 demand zone the next level below and 90.20 to 91.60 supply overhead.
- USD/JPY is trading at 157.99 right on both moving averages, inside a range between 156.10 and 158.95 that has held since September, with a Bank of Japan hike priced at about 80% for December.
- EUR/USD is trading at 1.1221 after a rebound from near 1.1132, just under the 1.1237 to 1.1273 supply zone, with the dollar softer on Monday ahead of the CPI test.
WTI Crude: Change of Character Lost as Peace Hopes Build
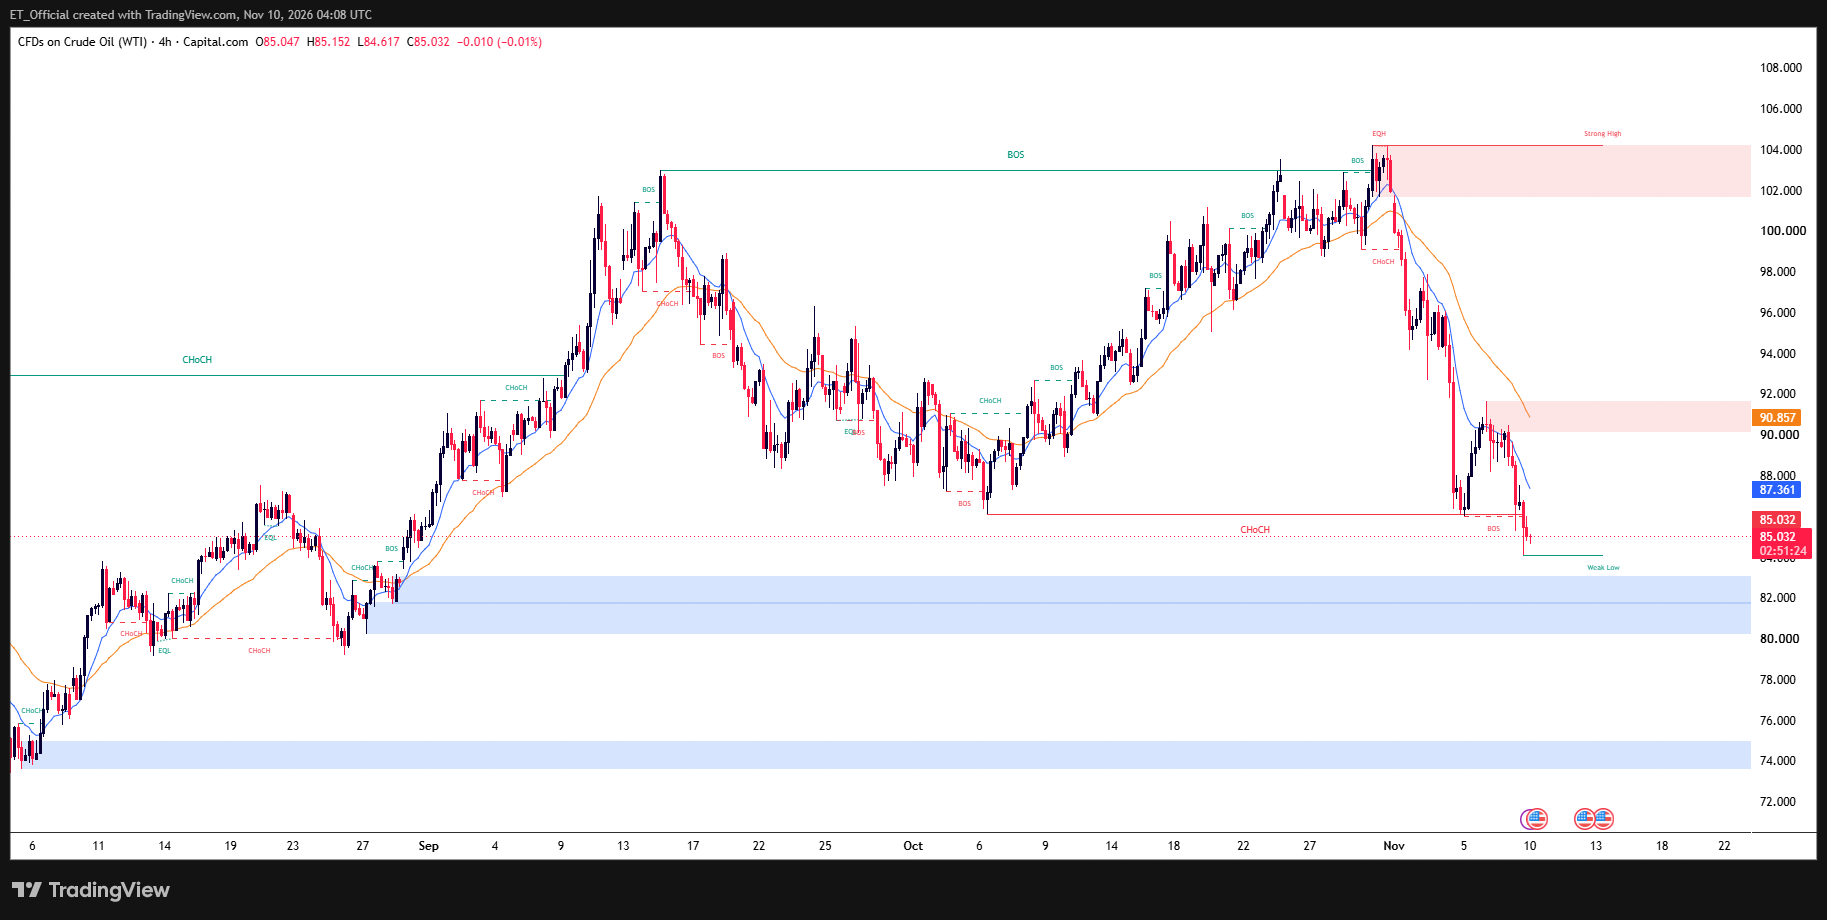
Chart: WTI Crude Oil (CFD), 4H timeframe (TradingView, SMC)
WTI crude oil 4H chart, 6 August to 10 November 2026: price rallied to a high near 104.30 on 30 October, fell through the 86.10 change of character level to a low near 84.60, and is trading at 85.03 below the 90.20 to 91.60 supply zone and above the 80.30 to 83.00 demand zone.
The 4H chart shows a sharp reversal from the 30 October high near 104.30, where a supply zone at 101.70 to 104.30 rejected price, followed by a bearish change of character near 99 and a fall of almost 20 dollars. Price bounced to the 90.20 to 91.60 supply zone last week, was rejected, and has now broken below the 86.10 change of character level, which was the early October low, to a new low near 84.60.
Price is trading at 85.03, below the faster average near 87.36 and the slower average near 90.86. Oil fell about 4% on Monday, with WTI settling near 86.85 to 87.07 and Brent near 92.6 to 92.9, its lowest since early September, after Trump said new strikes on Iran were highly unlikely if talks progress. Sources conflict on the talks, with Rubio calling Iran’s demands unrealistic and the US naval blockade still in place.
Below, 84.60 is the low to watch and a break opens the 80.30 to 83.00 demand zone, which held in late August. Above, 86.10 is the broken level that now acts as resistance, then 87.36 and the 90.20 to 91.60 supply zone, and a reclaim of 86.10 would suggest the breakdown is failing. Headlines on Iran, Hormuz and the blockade can move oil sharply in either direction, so wide stops and reduced size matter more than usual.
USD/JPY: Pinned on Its Averages Before CPI
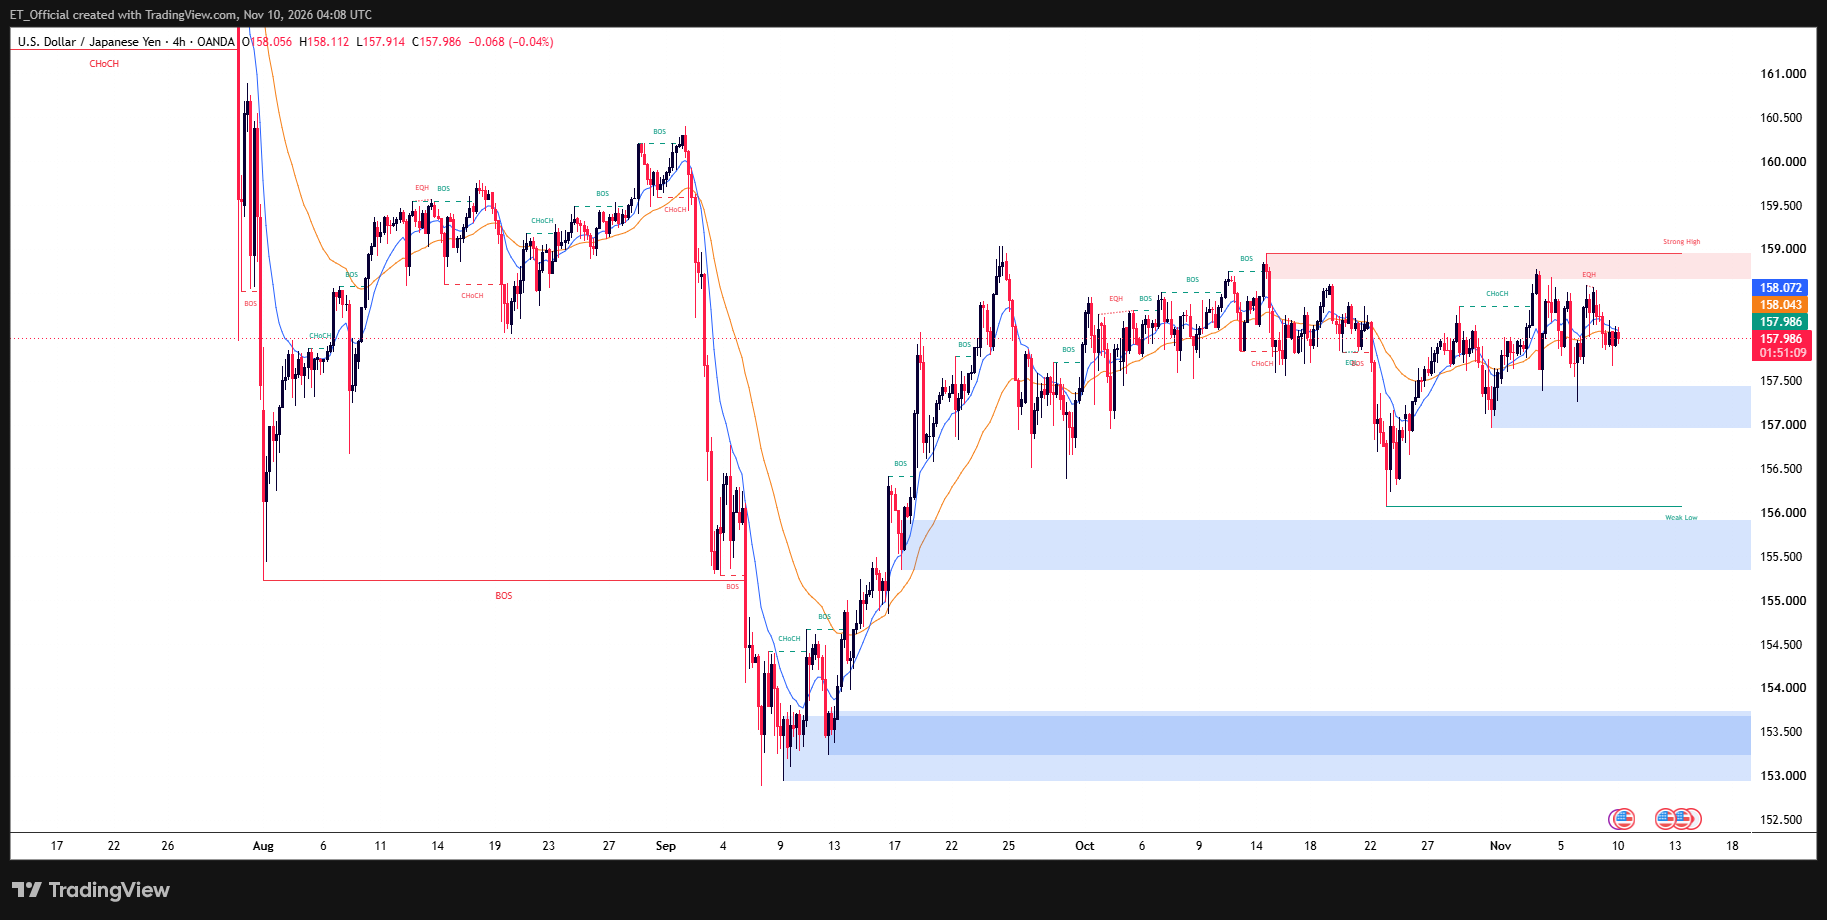
Chart: USD/JPY, 4H timeframe (TradingView, SMC)
USD/JPY 4H chart, 17 July to 10 November 2026: price has ranged between a low near 156.10 on 23 October and highs near 158.95 since 17 September, and is trading at 157.99 on both moving averages near 158.04 and 158.07, between the 157.00 to 157.45 demand zone and the 158.68 to 158.95 supply zone.
The 4H chart shows USD/JPY in a defined range since the 17 September low rebound, with supply at 158.68 to 158.95 capping every push, including the 14 October high near 158.95 and the 3 November high near 158.75. Support has come from the 157.00 to 157.45 demand zone, which held again last week with wicks to about 157.25, and the 23 October low near 156.10.
Price is at 157.99, sitting on both moving averages near 158.04 and 158.07 with small candles, which shows the market waiting for the release. The pair closed Monday near 157.7 to 157.9, with the dollar index down about 0.6% to near 101.7 after Friday’s jobs-driven rally, and the yen is sensitive to US yields and the interest rate gap.
A hot CPI that lifts hike odds and yields would likely push the pair into the 158.68 to 158.95 supply zone, and a close above 158.95 would open the 160 area and the September peak near 160.40. A soft print could pull it below 157.00, with 156.10 next. The Bank of Japan held at 1.25% on 30 October, about 80% of a December hike is priced per RoboForex, and Finance Minister Katayama again said on 2 November that Japan is ready to counter excessive speculative moves.
EUR/USD: Rebound Meets Supply Into CPI
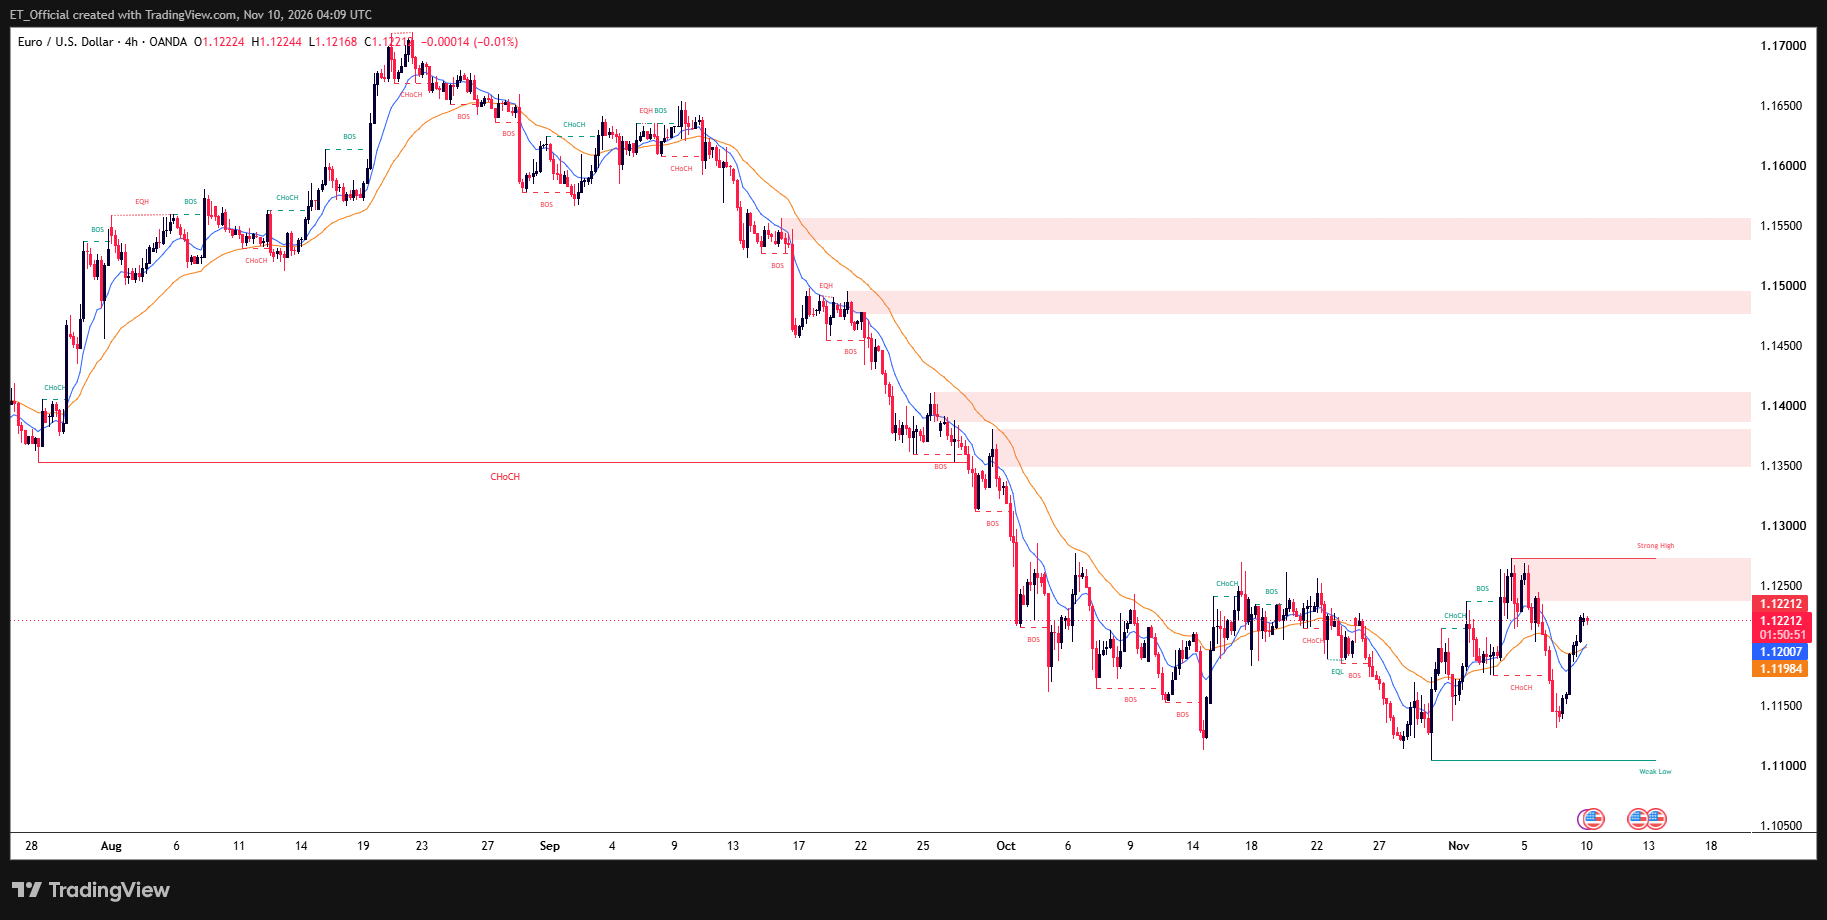
Chart: EUR/USD, 4H timeframe (TradingView, SMC)
EUR/USD 4H chart, 28 July to 10 November 2026: price fell from a high near 1.1700 on 21 August to a low near 1.1105 on 30 October, rebounded to 1.1273 on 4 November, and is trading at 1.1221 above both moving averages near 1.1200 and 1.1198 and below the 1.1237 to 1.1273 supply zone.
The 4H chart shows a long downtrend from the 21 August high near 1.1700, broken by supply zones at 1.1540 to 1.1555, 1.1475 to 1.1495 and 1.1350 to 1.1410, down to a low near 1.1105 on 30 October. Price has since formed a range, rejected at 1.1273 on 4 November, dropped to near 1.1132 last week, and rebounded to 1.1221.
Price is above both moving averages near 1.1200 and 1.1198, with the faster average turning up, and sits just under the 1.1237 to 1.1273 supply zone. EUR/USD closed Monday near 1.12, helped by the softer dollar, and hawkish European Central Bank comments are supporting the euro while Fed hike expectations support the dollar.
Above, 1.1237 to 1.1273 is the first test, and a close above 1.1273 would open 1.1350 to 1.1410. Below, the 1.1200 averages come first, then the 1.1132 low and the 1.1105 low, and a hot CPI would put those back in play. Euro area GDP follows on Friday, with US PPI at 13:30 UTC the same day.
Risk Warning: Trading financial instruments, particularly those involving leverage, involves a substantial degree of risk and is not appropriate for all investors. The value of your investments can rise or fall sharply, and it is possible to lose the entirety of your invested capital. Leveraged products, in particular, amplify both potential gains and losses. Before engaging in such trading, you must assess your financial goals, experience level, and appetite for risk. It is your sole responsibility to ensure that you understand the mechanics and risks of trading, including margin requirements, and to seek independent financial advice where appropriate. Do not trade with funds you cannot afford to lose. Nothing in this article constitutes financial advice or a personal recommendation, and nothing in this site should be read or construed as constituting advice on the part of Taurex or any of its affiliates, directors, officers or employees. All levels referenced are for educational and illustrative purposes only.