
For most of the past nine months, gold and the Australian dollar have been telling the same story. When one moved, the other followed. But that relationship is now starting to fracture, and the daily chart makes it clear exactly where the break is happening.
Key Points
- Gold and AUD/USD have moved in near lockstep on the daily chart since September 2025, driven by the same force: the US dollar. Both rallied when the dollar weakened (Q4 2025), both spiked when the Hormuz crisis hit (January), and both crashed when the Fed turned hawkish. But a divergence is now emerging that VIP clients should be paying close attention to.
- Gold has fallen 25% from its January all time high of $5,589 to $4,077 today, while AUD/USD is only 5.5% off its 0.7300 peak. The Aussie is holding up far better than gold, and the reason is simple: Australia’s interest rate advantage. The RBA sits at 4.35% after three consecutive hikes in 2026, compared to the Fed at 3.50% to 3.75%. Gold yields nothing.
- COT data tells the same story of divergence. Gold managed money positioning sits at the 50th percentile (completely neutral), while AUD leveraged money remains net long 41,538 contracts. But AUD asset managers are net short 31,451 contracts, creating a split that could resolve violently in either direction.
The Chart That Tells the Story
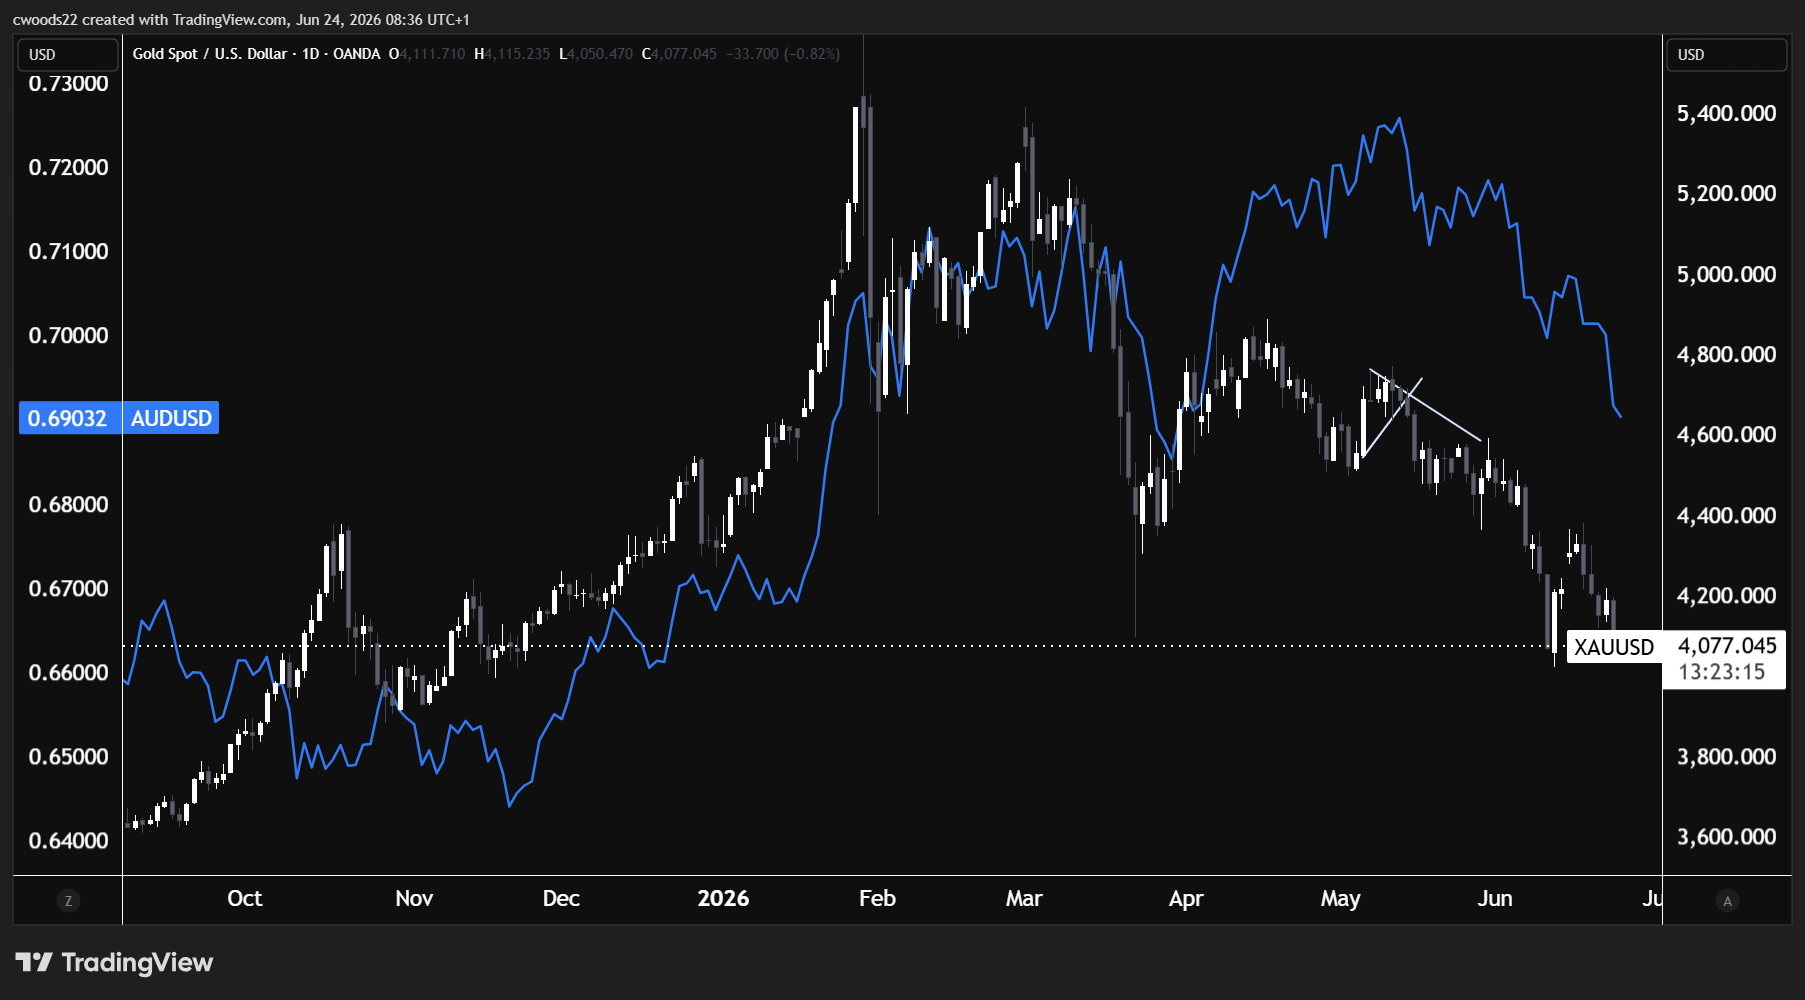
Chart: XAU/USD (candlesticks) vs AUD/USD (blue line), Daily timeframe (TradingView)
Nine Months of Moving Together
The daily chart shows three distinct phases where gold and the Aussie dollar moved in almost perfect sync. Phase one runs from September to December 2025. Gold climbed from around $3,600 to $4,200 while AUD/USD rallied from 0.6400 to 0.6800. Both assets were riding the same wave: a weakening US dollar, improving risk sentiment, and the broad commodity bid that comes with a falling greenback. Australia is the world’s third largest gold producer, and gold is now the country’s second largest export behind iron ore, with revenues forecast to hit $60 billion in 2025 to 2026. When gold prices rise, Australia’s export receipts swell, the trade balance improves, and institutional capital flows into AUD. The correlation was textbook.
Phase two was the Hormuz spike in January and early February. Gold surged to its all time high of $5,589 on safe haven demand as the Strait of Hormuz crisis shut in 10 million barrels per day. What made this interesting is that AUD/USD also rallied to 0.7300, which is unusual because the Aussie is traditionally a risk on currency, not a safe haven. But the move made sense: the broad USD selling was so aggressive that it lifted everything on the other side of the dollar. Commodity currencies, gold, and even crypto all benefited from the same dollar weakness. The correlation held because the driving force was the denominator, not the numerator.
Phase three was the crash from February through April. Gold fell from $5,589 to around $4,200, a 25% correction. AUD/USD dropped from 0.7300 to 0.6600. Once again, both assets moved in the same direction because the same force was driving them: the US dollar was strengthening as the Fed signalled it was in no hurry to cut rates. The correlation coefficient stayed above 0.70 through all three phases.
Where the Divergence Begins
Phase four, which covers May and June, is where the chart gets interesting and where VIP clients should be recalibrating their assumptions. Gold bounced from $4,200 back to $5,200 in May on the Iran ceasefire rally, then collapsed again. It sits at $4,077 today, down 27% from the all time high and making fresh seven month lows. The FOMC’s hawkish dot plot last week, where the median year end rate forecast jumped to 3.8%, was the latest blow. Gold is a non yielding asset, and when real yields rise, the opportunity cost of holding it becomes increasingly painful.
AUD/USD has not followed gold lower this time. It bounced from the April low of 0.6600 to 0.6900 and has been holding relatively steady, even as gold has plummeted through support level after support level. The Aussie is only 5.5% below its January peak, compared to gold’s 27% drawdown. The correlation that defined nine months of price action is breaking, and understanding why is the key to positioning correctly from here.
The Rate Advantage That Gold Cannot Match
The answer comes down to yield. The Reserve Bank of Australia hiked rates three consecutive times in 2026, pushing the cash rate to 4.35%. The RBA held at its June meeting but made clear that “inflation is still too high” and further hikes remain on the table. That puts the Australian cash rate above the Fed’s 3.50% to 3.75% range, giving the Aussie a positive rate differential of 60 to 85 basis points over the US dollar.
That rate advantage is acting as a floor under AUD/USD that gold simply does not have. When the Fed turned hawkish under Warsh and the dollar surged, gold had no defence. It yields nothing, generates no income, and its entire bull case rested on the expectation of falling real yields and a weaker dollar. Both of those assumptions have been demolished by the dot plot shift. AUD/USD, on the other hand, offers carry. Institutional investors holding long AUD positions are earning a positive yield differential, which softens the impact of dollar strength and makes it more expensive for speculators to maintain short AUD positions.
There is also a structural tailwind that most traders overlook. Australia’s gold mining sector is a natural hedge for the currency. When gold prices are elevated in USD terms and the AUD is weak, Australian miners receive amplified revenues in local currency. That boosts the trade balance, attracts capital inflows, and creates a self correcting mechanism that gold the commodity does not have. The World Gold Council noted that Australia’s macro position and gold export growth create a reinforcing loop that supports AUD even when gold prices are falling in dollar terms.
What the Smart Money Is Doing
The positioning data reinforces the divergence story. Gold’s managed money net long position sits at 113,721 contracts, right at the 50th percentile of the trailing 52 week range with a z score of negative 0.18. That is as neutral as it gets. The speculative community is not committed to gold in either direction. They added 7,858 net contracts last week, which is modest. This tells us the conviction behind the gold trade has evaporated. For context, the 52 week range runs from 89,752 to 163,519 net long, so current positioning is almost exactly in the middle. Retail sentiment confirms the ambiguity: 59% of traders are long gold, which is barely a lean in either direction.
AUD positioning is more interesting because it is split. Leveraged money is net long 41,538 contracts at the 64th percentile (z score 0.77), meaning the fast money is moderately bullish on the Aussie. But asset managers are net short 31,451 contracts, meaning the longer term institutional community disagrees. This divergence between leveraged money and asset managers often precedes a large move, though it does not tell us the direction by itself. The leveraged longs trimmed 754 contracts last week, a minor reduction that suggests they are not yet capitulating. Retail sentiment at 56% short AUD/USD (via Myfxbook) adds another layer: retail is betting against the Aussie, while the fast money is betting on it.
What Resolves This
The next 48 hours contain two catalysts that could either deepen the divergence or snap it back. Today’s Australian monthly CPI indicator (May data released in June) follows a headline reading that fell to 4.0% annually in May, down from 4.2%, which on the surface is encouraging for the RBA’s pause decision. But the trimmed mean (the core measure the RBA watches most closely) rose 0.4% month on month and lifted the annual core rate to 3.6%, which is above target. If today’s June data prints in a similar pattern, with headline easing but core remaining sticky, it gives the RBA cover to hold at 4.35% while keeping the hiking door open. That is supportive for AUD.
Thursday’s US Core PCE is the defining event for gold. The forecast is 0.3% month on month, up from 0.2% previously. If it comes in hot, it validates the Warsh dot plot, the dollar rallies further, and gold likely breaks below $4,050 toward $3,900. AUD would feel pressure too, but the rate differential would limit the damage. A soft Core PCE print below 0.2% would be the best scenario for a correlation snapback, with gold bouncing on lower rate expectations while AUD benefits from the risk on mood.
The levels to watch: for gold, $4,050 is the immediate support. A break below that opens the door to $3,900, which Morgan Stanley has flagged as a potential floor in a scenario where Core PCE triggers a real yield spike. On the upside, gold needs to reclaim $4,200 to shift the daily structure. For AUD/USD, 0.6850 is the near term support and 0.7000 is the psychological resistance. The divergence between the two assets is likely to persist as long as the RBA holds rates above the Fed. The moment that rate differential narrows, either through a Fed hike or an RBA cut, the correlation could reassert itself aggressively. Until then, the Aussie has a shield that gold does not.
Risk Warning: Trading financial instruments, particularly those involving leverage, involves a substantial degree of risk and is not appropriate for all investors. The value of your investments can rise or fall sharply, and it is possible to lose the entirety of your invested capital. Do not trade with funds you cannot afford to lose. Nothing in this site should be read or construed as constituting advice on the part of Taurex or any of its affiliates, directors, officers or employees.