
By Connor Woods, Global Head of Trading Education | 5 August 2026
Key Points
- Non Farm Payrolls is released on Friday 7 August at 12:30 UTC. The US economy is expected to have added 85,000 jobs in July, up from June’s 57,000 miss. A second consecutive weak print would seriously weaken the case for a September rate hike, which currently sits at 59% probability.
- Gold has surged 3.12% to $4,204, breaking above a descending trendline that has capped every rally since the $5,200 highs earlier this year. Two bull RSI divergences at the June and July lows provided the foundation for this move. Friday’s jobs number will determine whether this breakout holds or fails.
- Three scenarios matter. A weak print below 70K confirms the breakout and opens the door to $4,400. An in line number between 80K and 100K keeps gold elevated but facing resistance. A strong print above 120K risks a sharp reversal back below the trendline toward $4,000.
What Is Non Farm Payrolls?
Non Farm Payrolls, or NFP, is arguably the most important economic data release on the calendar. Published on the first Friday of every month at 12:30 UTC by the Bureau of Labor Statistics, it measures how many jobs the US economy added or lost during the previous month. The name comes from the fact that it excludes farm workers, government employees, private household staff, and employees of non profit organisations.
Why does it matter so much? Because the Federal Reserve watches the labour market more closely than almost anything else when deciding whether to raise, cut, or hold interest rates. A strong jobs number tells the Fed that the economy can handle higher rates. A weak number suggests the economy is slowing and may need support. This makes NFP one of the biggest market movers of the month.
Markets do not react to the number itself. They react to the gap between the forecast and the actual reading. If economists expect 85,000 jobs and the economy adds 150,000, that is a major upside surprise and the dollar typically rallies while gold falls. If the actual number comes in at 40,000 against an 85,000 forecast, that is a significant miss and the dollar typically weakens while gold rallies.
NFP is released alongside two other important numbers: the unemployment rate and average hourly earnings. The unemployment rate tells you how many people are actively looking for work but cannot find it. Average hourly earnings measures wage growth, which is a key driver of inflation. A strong NFP with rising wages is the most hawkish combination for the Fed. A weak NFP with flat or falling wages is the most dovish.
What to Expect on Friday
| Release | Forecast | Previous | Time (UTC) |
| Non Farm Payrolls | 85K | 57K | 12:30 |
| Unemployment Rate | 4.2% | 4.2% | 12:30 |
| Avg Hourly Earnings m/m | 0.3% | 0.3% | 12:30 |
| Canada Employment | 15.0K | 18.2K | 12:30 |
The consensus forecast for July’s NFP is 85,000 jobs. That would be an improvement from June’s 57,000 print, which missed the 110,000 forecast by 53,000 jobs and marked the weakest reading in over a year. Today’s ADP private payroll report (released ahead of NFP as a preview) carries a forecast of just 68,000, suggesting the private sector may still be struggling to hire.
The unemployment rate is expected to hold steady at 4.2%, and average hourly earnings are forecast at 0.3% month on month, unchanged from the previous reading. Canada releases its own employment data at exactly the same time (forecast 15,000 new jobs, unemployment rate 6.5%), which adds a second layer of volatility for North American markets.
Context matters here. The Federal Reserve held rates at 3.50% to 3.75% last week in a 9 to 3 vote, with three members pushing for an immediate hike. Chair Warsh warned that the Fed “will not hesitate” to raise rates further if the data justifies it. Markets are currently pricing a 59% probability of a September hike. Friday’s number will either push that above 70% or pull it back below 50%.
Gold: The Breakout That Needs Confirmation
Gold has been in a sustained downtrend since hitting record highs above $5,200 earlier this year. A descending trendline drawn from those highs has capped every rally for the past six months, with price making consistently lower highs at $4,800, $4,400, and $4,300 before selling off again.
That pattern broke today. Gold surged 3.12% to $4,204, decisively breaking above the descending trendline on strong volume. This is the first time in six months that the trendline has been violated to the upside.
The move was not a surprise to those watching the RSI. Two bull divergences formed at the June and July lows. While price was making lower lows, the RSI was making higher lows, signalling that selling pressure was fading even as the headline price continued to drop. A change of character bullish near the $4,200 level confirmed the structural shift.
The breakout now faces its first real test: Friday’s NFP. Gold pays no income, so it competes directly with bonds and savings accounts. When interest rate expectations rise, gold suffers because holding it means missing out on yield elsewhere. When rate expectations fall, gold rallies because the opportunity cost of holding it drops.
Supply sits in a stacked formation between $4,400 and $4,800. These are the zones where previous rallies stalled and sellers stepped in. Demand is clear at $4,000 to $4,100, where the breakout originated. The descending trendline (now broken) sits just below current price and could act as support on a retest.
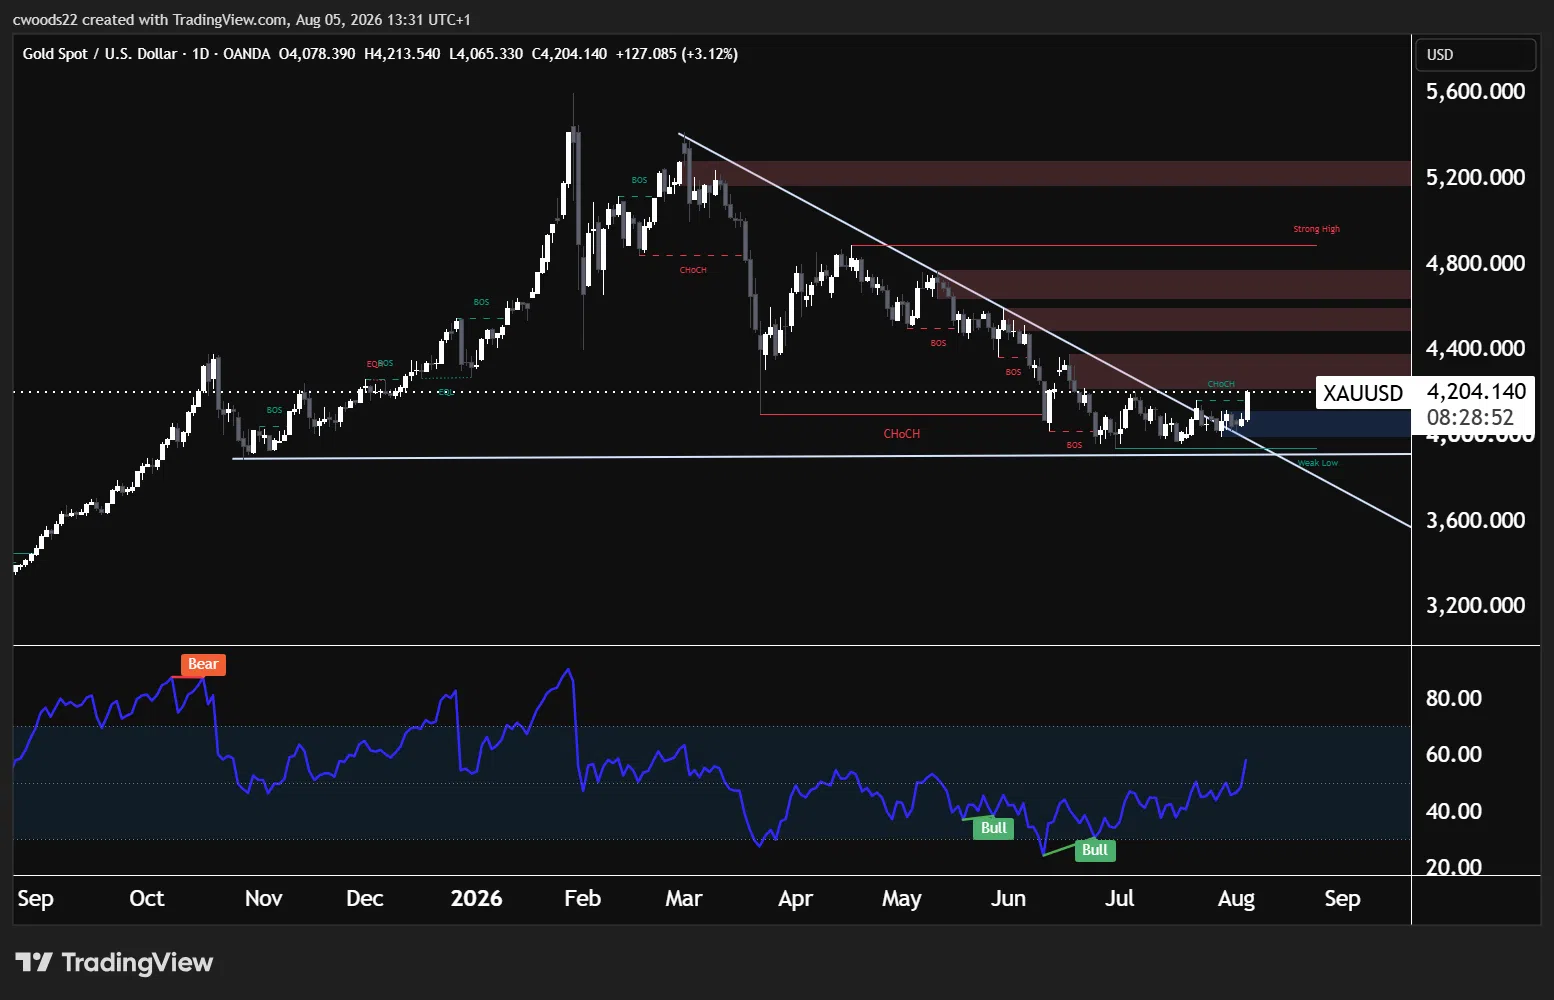
Chart: Gold (XAUUSD), Daily timeframe (TradingView, SMC)
Three Scenarios for Friday
Weak NFP (below 70K)
A second consecutive major miss would make it very difficult for the Fed to justify a September hike. Rate expectations collapse, the dollar sells off, and gold confirms the trendline breakout. The first target becomes the $4,400 supply zone, with $4,600 to $4,800 in play if the move carries momentum. This is the scenario where the breakout gets its validation.
In line NFP (80K to 100K)
An in line print keeps the September hike debate alive without resolving it. Gold holds above the trendline but faces resistance at $4,400. Markets shift their attention to US CPI on August 12 and Jackson Hole at the end of the month for further direction. The breakout remains intact but untested.
Strong NFP (above 120K)
A surprise to the upside would push September hike probability above 70% and trigger a sharp dollar rally. Gold risks a swift reversal back below the broken trendline. If the trendline break fails, price targets the $4,000 to $4,100 demand zone where the two bull RSI divergences originally formed. This would mark a false breakout.
Risk Warning: Trading financial instruments, particularly those involving leverage, involves a substantial degree of risk and is not appropriate for all investors. The value of your investments can rise or fall sharply, and it is possible to lose the entirety of your invested capital. Do not trade with funds you cannot afford to lose. Nothing in this site should be read or construed as constituting advice on the part of Taurex or any of its affiliates, directors, officers or employees.