
Key Points
- Natural gas is the forgotten casualty of the Iran conflict. While oil has rallied 24% in two weeks, natural gas has barely moved from $2.94, and yet the supply disruption to LNG is arguably more severe. Laden LNG transits through the Strait of Hormuz have fallen from 0.8 cargoes per day in late June to just 0.2, effectively shutting down Qatar’s exports, which account for nearly 20% of global LNG trade.
- European gas storage sits at just 53.7% of capacity, a 21.3 percentage point deficit to the five year seasonal norm of 75%. The EU has already relaxed its mandatory winter target from 90% to 80%, and current projections show storage reaching only 77.9% by November. If Hormuz remains disrupted through the summer injection season, Europe enters winter dangerously undersupplied.
- The daily chart shows natural gas rangebound between the $2.60 demand zone (where two bull RSI divergences confirmed the low) and the $3.40 level where three equal highs are holding as resistance. A bearish change of character at $3.00 has driven the current pullback to $2.94, but the equal highs at $3.40 represent liquidity that will eventually be swept if the fundamental backdrop deteriorates further.
The Forgotten Casualty of Hormuz
Every trader on the planet is watching oil right now. WTI at $85, Brent near $88, the Strait of Hormuz effectively closed, tankers getting attacked. And yet almost nobody is asking the question that, in my view, matters just as much: what is happening to natural gas?
The answer is that the LNG market is being quietly strangled. Laden LNG transits through the Strait of Hormuz have fallen from roughly 0.8 cargoes per day in late June to just 0.2 by mid-July. That is a 75% collapse in shipments. Qatar, the world’s second largest LNG exporter, ships 93% of its LNG through the Strait. The UAE ships 96% through it. Together, those two countries account for nearly one fifth of all global LNG trade. There are no alternative routes. Unlike oil, which can be rerouted around Africa at higher cost, Qatari LNG has one way out and it is through Hormuz.
Qatar has responded by pausing all new LNG expansion projects after one of its carriers, the Al Rekayyat, was attacked near Oman. That is not a temporary disruption. That is a strategic withdrawal from growth, and it sends a signal to every LNG buyer in Asia and Europe that the supply they were counting on for the next decade just became uncertain.
Europe’s Storage Problem
And this is where it connects to the bigger picture. European gas storage is sitting at 53.7% of capacity as of July 20. The five year seasonal norm at this point in the year is 75%. That is a 21.3 percentage point deficit, and it is the widest gap since the 2022 energy crisis.
The EU has already acknowledged the problem by relaxing the mandatory winter storage target from 90% to 80%. Even with the lower bar, current injection rates project storage reaching only 77.9% by November 1. If the Hormuz closure persists through the summer injection season, that number drops further. Europe’s winter buffer is dwindling at the exact moment when its primary alternative supply route (LNG from Qatar) is being shut off.
On top of that, the Houthis have declared a maritime embargo against Saudi Arabia, which threatens LNG shipments through the Red Sea as well. And China’s ongoing LNG buying spree is tightening the global market from the demand side. The competition for available cargoes is intensifying just as supply is being removed.
The Winter Premium Is Already Priced
On the US side, the picture is more nuanced. The EIA projects US dry gas production hitting a record 111 billion cubic feet per day in 2026, with LNG exports also at record levels of 16.7 bcf per day. American production is keeping domestic prices suppressed relative to where they would be if the US faced the same supply constraints as Europe and Asia.
But here is what the market is already pricing. The December 2026 Henry Hub futures contract is trading above $4 per MMBtu, while the spot price sits at $2.94. That winter premium of more than $1 reflects the market’s expectation that seasonal demand (heating season plus continued LNG export growth) will tighten the supply balance significantly by Q4. The EIA’s full year 2026 average forecast of $3.70 also sits well above the current spot price.
A summer heatwave in early July pushed power sector gas demand up 15% week on week, averaging 45.6 bcf per day. If extreme heat persists through August, storage injections slow further, compounding the winter supply concern.
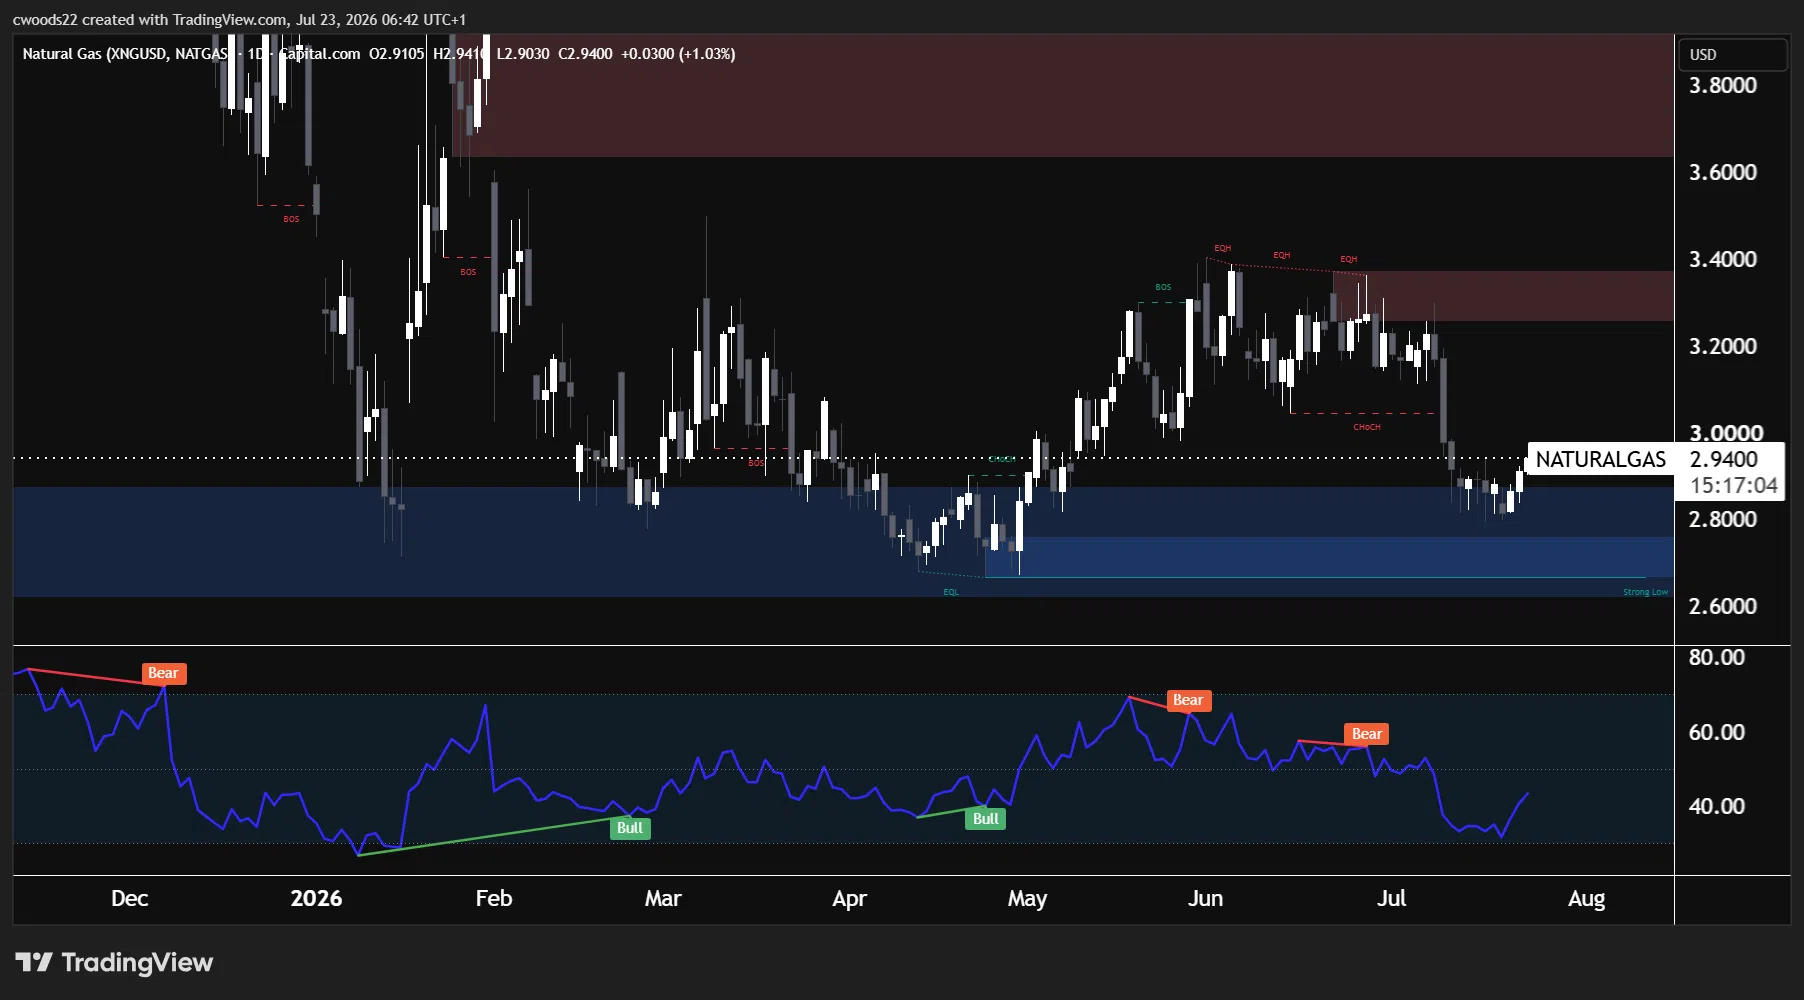
Chart: Natural Gas (XNGUSD), daily timeframe (TradingView, SMC)
The Chart: Range, Liquidity, and the Next Move
The daily chart tells a clean structural story. Natural gas sold off from the $3.60 to $3.80 supply zone in late 2025 through a series of break of structure moves, bottoming at $2.60 in April and May where two bull RSI divergences confirmed the selling had exhausted. The annotation marks this as the equal lows and the low of the range.
The recovery from $2.60 was impulsive. Price rallied through $3.00 with a bullish break of structure and pushed to $3.40, where it printed three equal highs across June and into July. In Smart Money terms, those equal highs represent liquidity sitting above the current range. They are a magnet for price if the buyers take control again.
Two bear RSI divergences at the June and July highs signalled that the rally was overextended, and the bearish change of character at $3.00 confirms that sellers have retaken short term control. Price has pulled back to $2.94, sitting right at the horizontal level that has acted as a pivot throughout 2026.
The range is clear: $2.60 demand at the bottom (where the equal lows and the confirmed low sit) and $3.40 at the top (where the equal highs provide the liquidity target). The current pullback to $2.94 is a retracement within that range, and the fundamental backdrop suggests the next leg is more likely to test the highs than the lows.
If the Hormuz disruption persists and European storage remains below target heading into autumn, the $3.40 equal highs will be swept, opening the path toward the $3.60 to $3.80 supply zone where the November 2025 highs sit. On the downside, a diplomatic breakthrough that reopens Qatar’s LNG routes would relieve the supply pressure and could see price revisit $2.60 to $2.80 demand.
View our economic insights for the full calendar of events this week and their potential market impact.
Risk Warning: Trading financial instruments, particularly those involving leverage, involves a substantial degree of risk and is not appropriate for all investors. The value of your investments can rise or fall sharply, and it is possible to lose the entirety of your invested capital. Do not trade with funds you cannot afford to lose. Nothing in this site should be read or construed as constituting advice on the part of Taurex or any of its affiliates, directors, officers or employees.