
Key Points
- Gold sits at $4,065, down roughly 19% from its January highs above $5,000. Two bull RSI divergences on the daily chart suggest selling pressure is fading, but the trend remains bearish. The $3,900 to $4,000 demand zone is the floor that matters this month.
- The US Dollar Index was rejected from the 101.50 to 102.00 supply zone and has pulled back to 99.80. A bearish structural shift near 100.00 opens the door to 97.50 to 98.00 if US data disappoints.
- August is loaded. NFP and a BoE rate cut land on the same day (Friday 7th), US CPI follows on the 12th, and Jackson Hole closes the month. Everything feeds into September, where the ECB, Fed, and BoJ all meet within eight days of each other.
July in Review
July delivered two major shocks. The Federal Reserve held rates at 3.50% to 3.75% in a 9 to 3 vote, with three members pushing for an immediate hike. Chair Warsh warned that the Fed “will not hesitate” to raise rates further. The Dow dropped over 1,100 points on the day.
Oil collapsed from $92 to below $80 after reports of a Hormuz reopening deal between the US and Iran. Iran denied any agreement exists, but the damage was done. The Bank of Japan held at 1.00% but signalled a September hike is on the table, and Japanese authorities intervened in the yen, spiking USDJPY from 162.80 to 157 in an hour.
Equities ended mixed. The S&P 500 closed at 7,489 (+1.03%), the NASDAQ 100 at 28,274 (+0.84%), and the Nikkei 225 led at 63,661 (+2.08%). The US 10 year yield sits at 4.68%.
Gold: Two Divergences and a Decision
Gold has sold off relentlessly since hitting record highs above $5,000 in January. The daily chart shows a sustained downtrend through a series of bearish structural breaks, with price currently at $4,065.
Supply sits between $4,200 and $4,400 (the May to June breakdown zone) and again at $4,700 to $4,800. Any rally into these areas is likely to meet selling pressure. On the downside, demand between $3,900 and $4,000 has held twice in recent months and is the key level for August.
The interesting signal is in the RSI. Two bull divergences have formed at the June and July lows. This means that while price has been making lower lows, momentum has been making higher lows, suggesting the selling pressure is fading. This often signals a potential bounce, but gold needs a catalyst to act on it.
That catalyst is interest rates. Gold pays no income, so it competes directly with bonds and savings accounts that do. When rates are high, gold suffers. When rate expectations fall, gold rallies. If August’s data (NFP, CPI) shows the economy cooling, rate hike expectations ease and gold could test the $4,200 to $4,400 supply zone. If the data keeps the Fed hawkish, the $3,900 floor comes under real pressure.
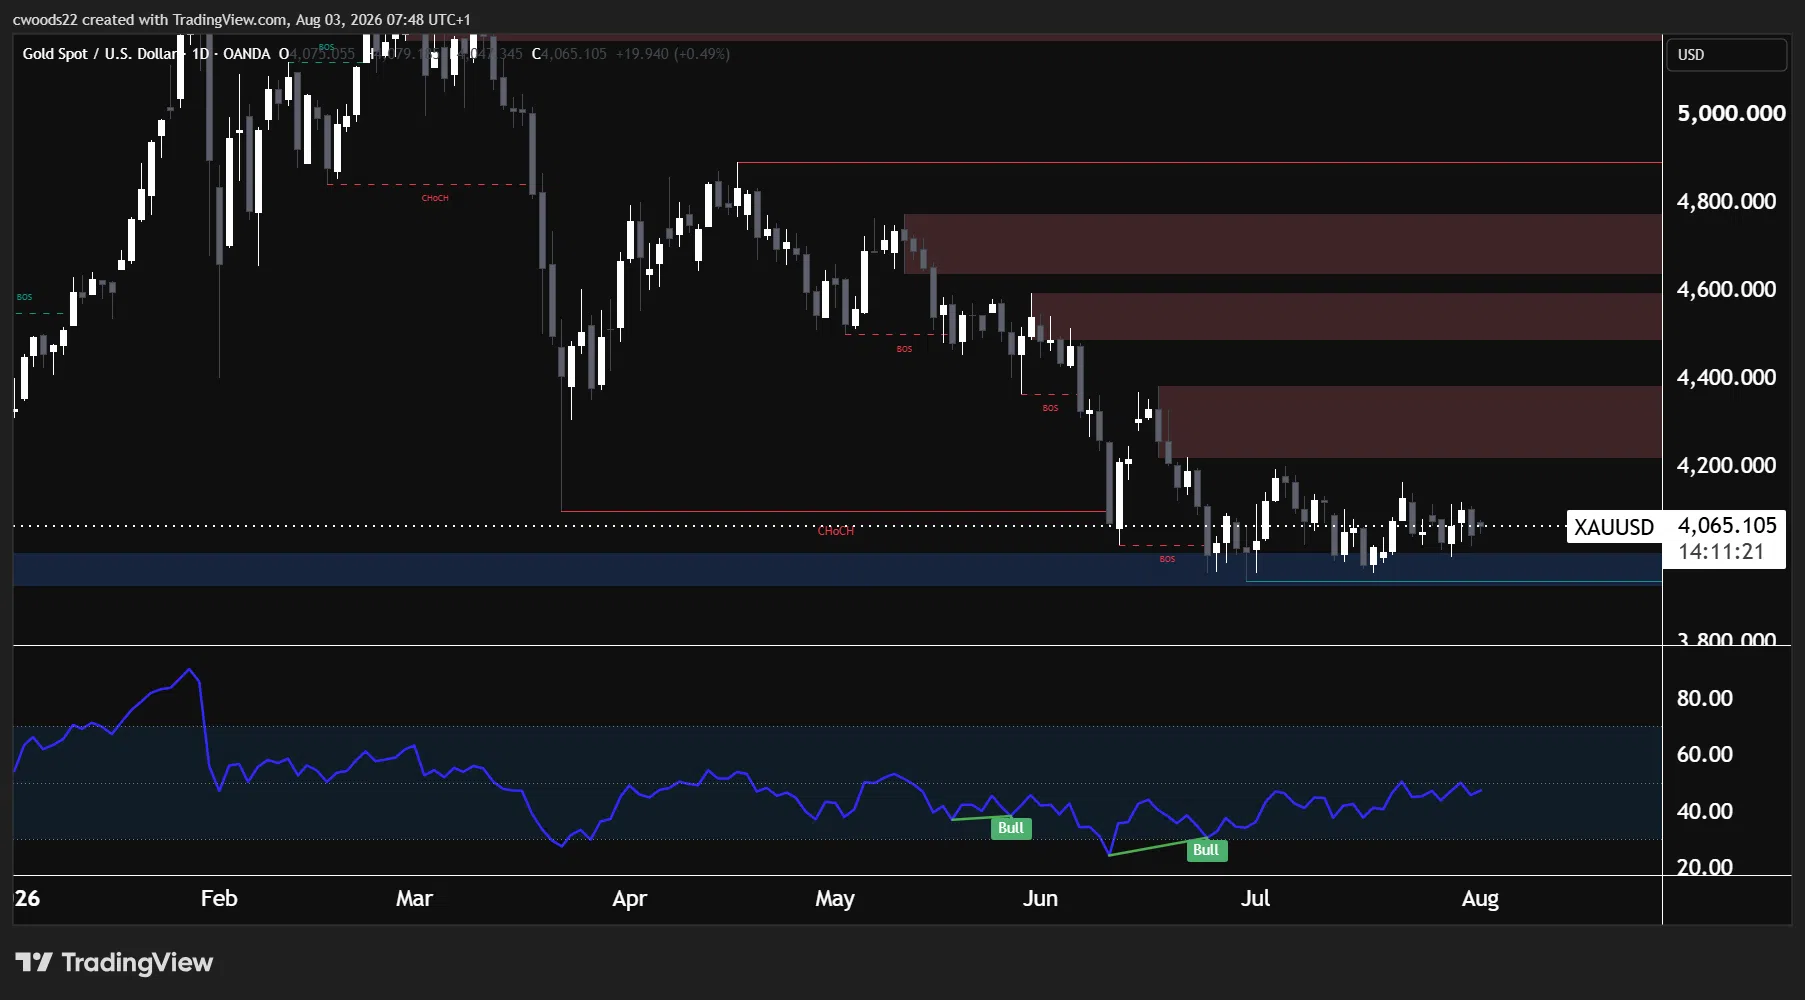
Chart: Gold (XAUUSD), Daily timeframe (TradingView, SMC)
The Dollar: Rejected from Resistance
DXY has spent most of 2026 trapped in a range between 97.50 to 98.00 demand and 101.50 to 102.00 supply. In late July, the hawkish Fed pushed the dollar toward the top of that range before it was rejected and pulled back to 99.80.
The daily chart shows a bearish structural shift near 100.00, breaking the pattern of higher highs and higher lows that had been building since May. Two bear RSI divergences at the early 2026 and March highs confirm that rallies are losing momentum at the top of the range. A bull RSI divergence at the May lows confirms the demand zone at 97.50 to 98.00 is well supported.
The fundamental picture is conflicted. The Fed’s hawkish stance and 59% September hike pricing support the dollar. But the labour market is cooling (NFP missed by 53,000 jobs last month), and if that trend continues, the case for tightening weakens. August’s data will resolve this: strong numbers push DXY back toward 101.50 to 102.00, weak numbers send it toward 98.00 to 99.00.
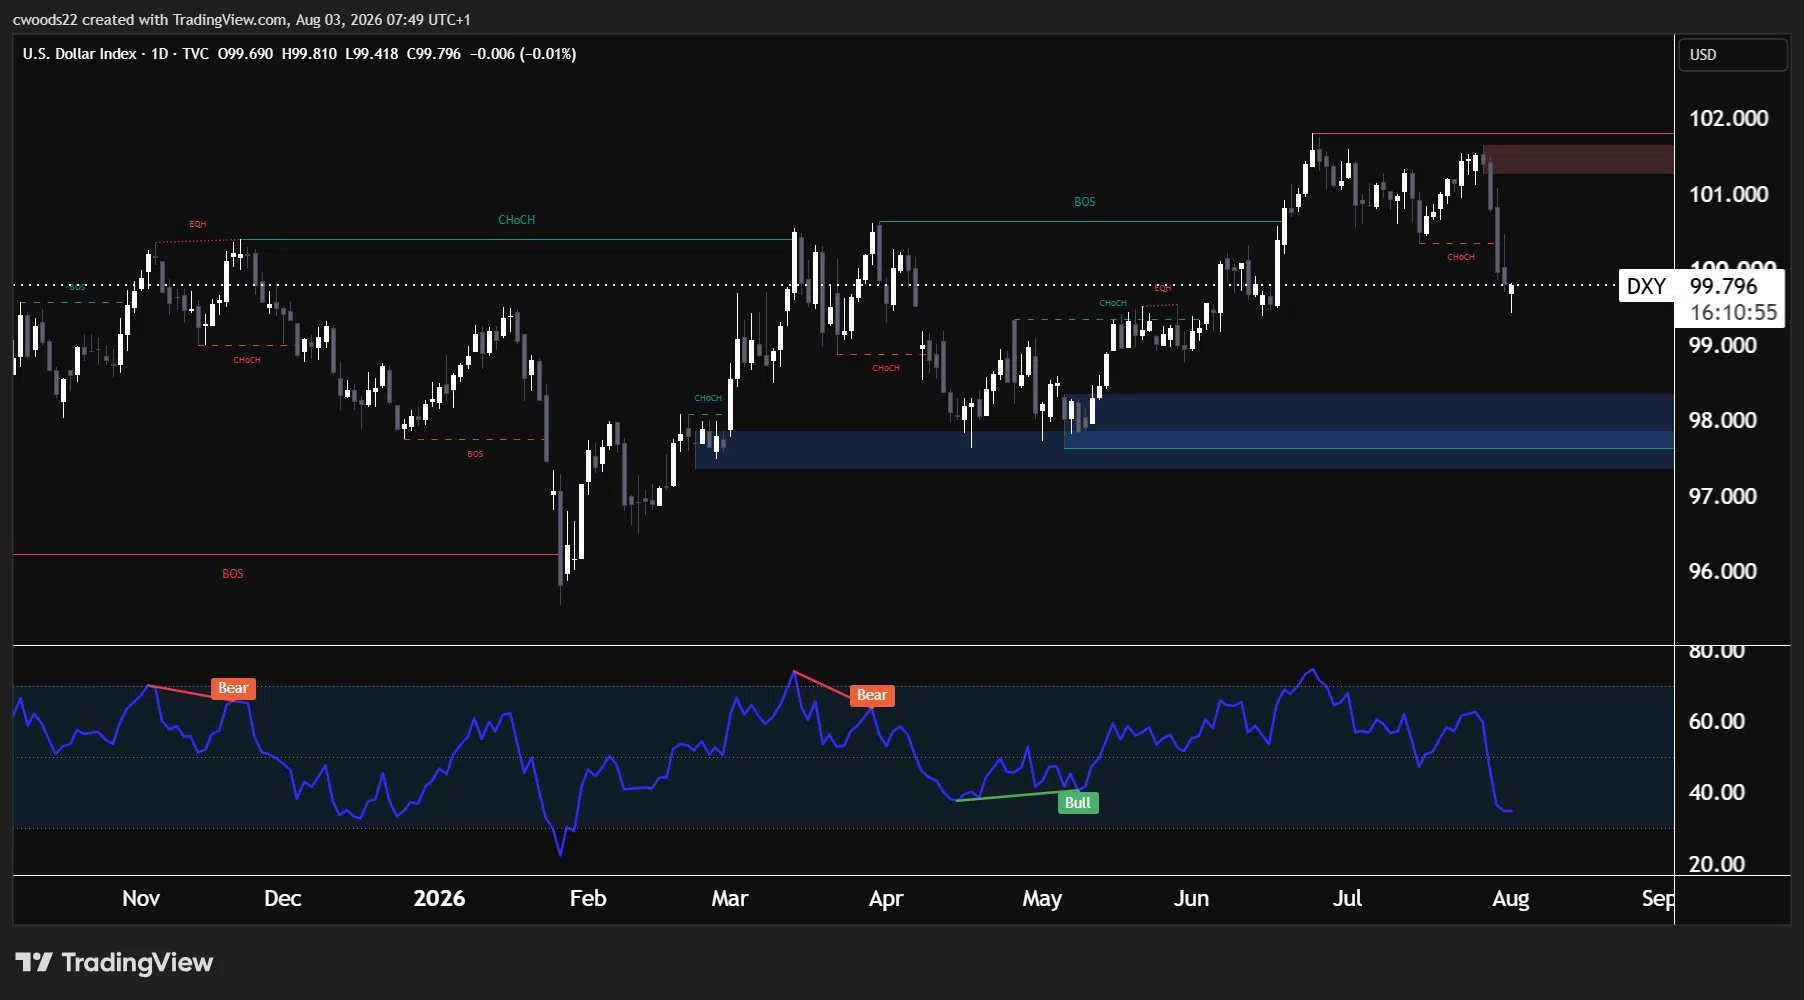
Chart: US Dollar Index (DXY), Daily timeframe (TradingView, SMC)
What to Watch in August
A quick guide to every major event this month and what it could mean for markets.
Non Farm Payrolls (Friday 7 August)
The biggest data release of the month. Forecast is 88K, up from June’s 57K miss (against a 110K forecast). A second consecutive weak print makes it very difficult for the Fed to justify a September hike. A strong number above 100K pushes hike probability above 70%. Canada releases its employment data on the same day (forecast 15.0K), giving a broader read on the North American labour market.
BoE Rate Decision (Thursday 7 August)
The Bank of England is expected to cut rates by 25 basis points to 4.00% after holding at 3.75% for five consecutive meetings. The expected vote is 6 to 3. If confirmed, this makes the UK the first major central bank to ease policy in this cycle. A cut would widen the rate gap with the US and could weigh on GBP/USD, while signalling to markets that rate cuts are coming globally, even if the Fed is still talking about hikes.
RBA Rate Decision (Tuesday 11 August)
The Reserve Bank of Australia is expected to hold rates steady, but the tone matters. Australian inflation remains stubbornly above target, and any hawkish shift could support the Aussie dollar. A dovish surprise would add to the theme of central banks beginning to ease.
US CPI (Tuesday 12 August)
June’s headline CPI came in at 3.9% year on year, down from 4.5%. If July’s reading continues that downward trend, it weakens the case for a September hike and could trigger a dollar selloff and gold rally. If inflation ticks higher, it gives the three dissenting Fed members exactly the ammunition they need.
UK CPI (Wednesday 19 August)
Coming 12 days after the expected BoE rate cut, this print will show whether UK inflation is cooperating with the decision to ease. A higher than expected reading would put the BoE under pressure and raise questions about whether the cut was premature.
Oil and the Hormuz Question
WTI crashed from $92 to below $80 on deal hopes, but Iran denies any agreement exists. If a credible deal materialises, oil falls further toward $68 to $72, which lowers imported inflation and weakens the case for rate hikes globally. If talks collapse, oil spikes back toward $88 to $92 and inflation fears return. This is the wildcard that could override every other theme this month.
Jackson Hole (27 to 29 August)
The defining moment of the month. Chair Warsh will have seen July’s NFP, CPI, and three weeks of August data by the time he speaks. The official theme is “Financial Innovation: Implications for Payments and Policy,” but the market cares about one thing: does Warsh signal a September hike or a hold? His tone here will set the direction for the dollar, gold, and equities heading into the final quarter.
The September Gauntlet (Looking Ahead)
August sets the table for a historic stretch of central bank decisions. The ECB meets on September 10 with a hike almost fully priced in. The FOMC follows on September 16 (59% hike probability). The Bank of Japan meets on September 18 with a possible hike to 1.25%. Three major central banks in eight days. How markets are positioned for this stretch will be shaped entirely by what happens in August.
Key Dates
All times shown in UTC.
| Date | Time (UTC) | Event | Detail |
| Mon 3 Aug | 14:00 | ISM Manufacturing PMI (USD) | Forecast 54.0 |
| Wed 5 Aug | 12:15 | ADP Employment Change (USD) | Forecast 71K |
| Thu 7 Aug | 11:00 | BoE Rate Decision (GBP) | Expected cut to 4.00% |
| Fri 7 Aug | 12:30 | Non Farm Payrolls (USD) | Forecast 88K |
| Fri 7 Aug | 12:30 | Canada Employment Change (CAD) | Forecast 15.0K |
| Tue 11 Aug | 04:30 | RBA Rate Decision (AUD) | Hold expected |
| Tue 12 Aug | 12:30 | US CPI (July data) (USD) | Key for Jackson Hole |
| Wed 19 Aug | 06:00 | UK CPI (July data) (GBP) | Post BoE cut context |
| Thu 27 Aug | — | Jackson Hole begins (USD) | Aug 27 to 29 |
| Fri 28 Aug | — | Jackson Hole (Warsh speech expected) (USD) | Rate path signal |
| Wed 10 Sep | 12:15 | ECB Rate Decision (EUR) | Hike almost fully priced |
| Tue 16 Sep | 18:00 | FOMC Rate Decision (USD) | 59% pricing a hike |
| Fri 18 Sep | 03:00 | BoJ Rate Decision (JPY) | Hike to 1.25% possible |
View our economic calendar here for the full schedule of events and their potential market impact.
Risk Warning: Trading financial instruments, particularly those involving leverage, involves a substantial degree of risk and is not appropriate for all investors. The value of your investments can rise or fall sharply, and it is possible to lose the entirety of your invested capital. Do not trade with funds you cannot afford to lose. Nothing in this site should be read or construed as constituting advice on the part of Taurex or any of its affiliates, directors, officers or employees.