Key Points
- Palladium has collapsed 38% from its $2,200 weak high to $1,354, and most traders have written it off entirely. But this is the most structurally interesting precious metal on the board right now. Over 80% of global palladium demand comes from catalytic converters in petrol and diesel vehicles, and while the EV transition narrative has crushed sentiment, the reality is more nuanced. Hybrid vehicles still require catalytic converters, and Goldman Sachs has raised its hybrid sales forecast to 12% of the global market by 2030, partially offsetting the BEV substitution threat.
- The supply picture is where palladium gets truly compelling. Russia and South Africa together control 75% of global primary production, and Russian mine output is at its lowest level in two decades. Mine supply is forecast to fall 3% in 2026 even as recycling volumes recover. The market has been in persistent deficit since 2012 and is only now approaching a potential surplus, making this a critical inflection year.
- The daily chart shows a bull RSI divergence forming at the recent lows after three bear divergences drove the sell off from $2,200. The strong low at $1,050 represents the structural floor, and the equal lows near $1,200 are the next liquidity target below. The question for VIP traders is whether this divergence signals the start of a recovery leg toward the $1,500 to $1,600 supply zone, or simply a pause before the final leg lower.
The Precious Metal Nobody Is Watching
Every precious metals trader knows gold. Most have an opinion on silver. Some even trade platinum. But palladium? It barely registers. The metal that rallied from $500 to over $3,000 between 2016 and 2022, one of the most explosive commodity moves of the last decade, has been quietly forgotten. And that is exactly why it deserves your attention.
At $1,354, palladium sits 38% below its 2026 high of $2,200 and over 55% below its all time peak. The narrative is simple and, on the surface, compelling: electric vehicles do not need catalytic converters, so palladium demand is structurally declining. Sell it and move on. But the story underneath is far more complex, and for VIP traders willing to look beyond the headline, the risk reward is starting to shift.
The EV Narrative vs the Reality
The bull case for palladium has always been about one thing: catalytic converters. Roughly 80% of global palladium demand comes from autocatalysts used in petrol and diesel vehicles to reduce harmful emissions. When the world was buying combustion engine cars, palladium was in chronic deficit. Now that the world is supposedly switching to EVs, that demand is at risk.
But “supposedly” is doing a lot of heavy lifting in that sentence. Battery electric vehicle adoption has been slower than projected in nearly every major market. More importantly, the gap is being filled by hybrids, not by consumers keeping their old cars. Goldman Sachs now forecasts hybrid vehicles will account for 12% of the global market by 2030, with plug in hybrids at 14%. Both of those powertrains still require catalytic converters, and in many cases they use more palladium per vehicle than a standard petrol engine because of the stop start cycling that puts additional stress on the catalyst.
Add to that the finalisation of Euro 7 emission standards for light commercial vehicles and the tightening of US EPA GHG Phase 3 standards for heavy duty vehicles. Both regulations require more advanced catalytic systems, which means more palladium loading per vehicle even as the total number of combustion vehicles eventually declines. The demand destruction story is real in the long run, but the timeline is measured in decades, not quarters.
Supply: The Most Concentrated Market in Precious Metals
This is where palladium becomes genuinely fascinating. Russia and South Africa together control approximately 75% of global primary palladium production. Russia alone (through Nornickel) accounts for roughly 40%, and South Africa around 35%. There is no other major commodity with this level of supply concentration.
Russian mine production is at its lowest level in at least two decades, squeezed by Western sanctions and underinvestment. South African mines face persistent energy disruptions (Eskom load shedding has been a recurring issue since 2022) and declining ore grades at ageing shafts. Combined primary supply is forecast to fall 3% in 2026.
The partial offset comes from recycling. Secondary palladium supply from scrapped catalytic converters is projected to surpass 80 metric tonnes by 2026 according to Johnson Matthey, a 10% increase year on year. But recycling alone cannot replace the primary supply gap. The market has been in deficit continuously from 2012 to 2025. The projected shift to a marginal surplus of roughly 2 tonnes in 2026 is paper thin and could easily flip back into deficit if Russian supply disappoints further or if recycling collection rates underperform.
There is also a wildcard that almost nobody discusses: hydrogen. Palladium is one of the most effective catalysts for hydrogen purification, storage, and fuel cell applications. As a thin membrane, palladium allows hydrogen to permeate while blocking all other gases, making it essential for the hydrogen economy that governments worldwide are investing in. This demand source is nascent today, but it represents a structural floor under palladium that did not exist a decade ago.
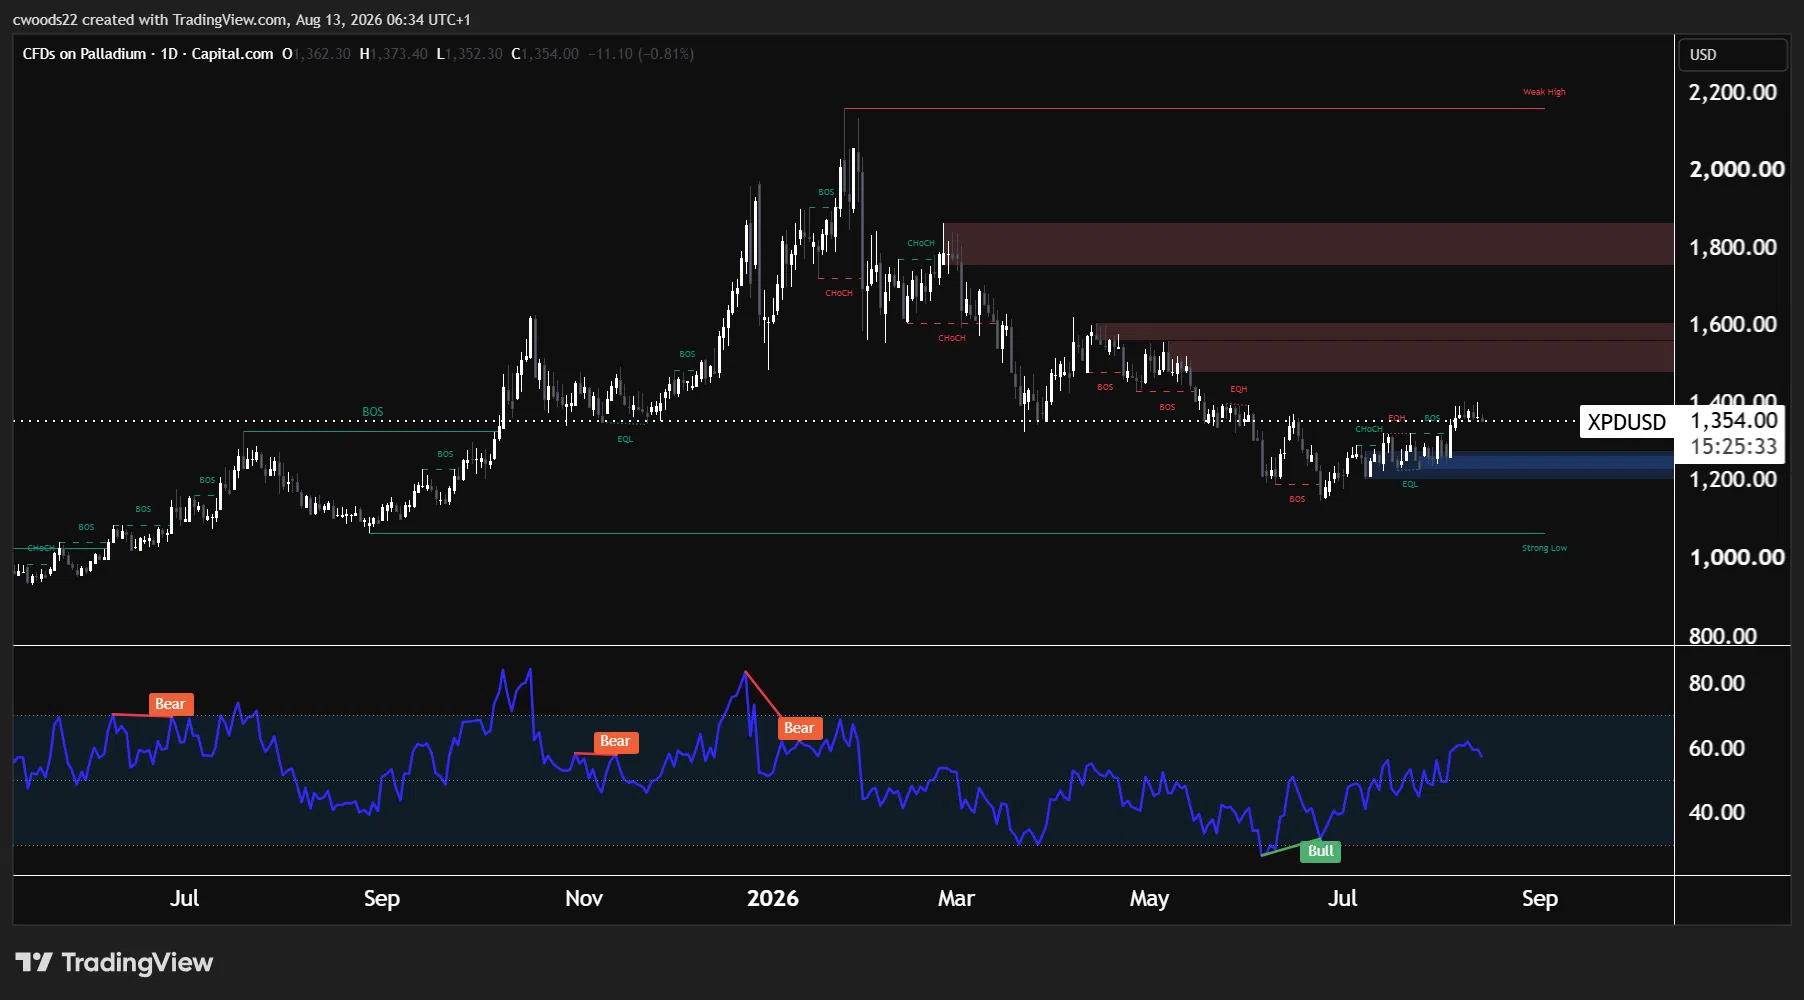
Chart: Palladium (XPDUSD), daily timeframe (TradingView, SMC)
The Chart: From Excess to Exhaustion
The daily chart tells a story of excess, correction, and potential exhaustion. Palladium rallied from the $800 area in mid 2025 through a sequence of bullish break of structure signals, ultimately reaching a weak high at $2,200 in late 2025. Three bear RSI divergences formed during that rally, each one warning that momentum was fading even as price pushed higher. The final divergence preceded the reversal.
The decline has been brutal. Multiple changes of character and breaks of structure on the way down confirmed the bearish shift, and price has since fallen through two major supply zones. The first sits between $1,750 and $1,900, and the second between $1,500 and $1,600 where the equal highs (EQH) at approximately $1,500 represent institutional liquidity that was tapped on the way down.
Price is now at $1,354, sitting below the dotted pivot near $1,400 and above the equal lows (EQL) at approximately $1,200. Those equal lows are significant in Smart Money terms because stop losses accumulate at those levels, making them a natural liquidity target if selling pressure continues. Below the equal lows, the strong low at $1,050 (marked by the green horizontal) is the structural floor. This level must hold for the broader recovery thesis to remain valid.
The most important signal on the chart right now is the bull RSI divergence forming at the July lows. Price printed lower lows while RSI printed higher lows, suggesting that selling momentum is fading. This mirrors the pattern at the February and March 2026 lows when a similar divergence preceded a bounce toward the $1,500 area.
If the bull divergence plays out, the first upside target is the $1,400 pivot, followed by the $1,500 to $1,600 supply zone where sellers previously stepped in. A reclaim of $1,600 would signal a potential structural shift and open the path toward the $1,750 to $1,900 area. Conversely, if the equal lows near $1,200 are swept and the strong low at $1,050 comes under pressure, the bearish structure is intact and lower levels become the focus.
Analyst forecasts reflect this uncertainty. The Reuters median for 2026 sits at $1,262, Morgan Stanley projects $1,325, while Bank of America has a target of $1,725 and the LBMA consensus is $1,740. The bull case extends as high as $2,900. That spread tells you everything about how divided the market is, and divided markets are where VIP traders tend to find the best opportunities.
Risk Warning: Trading financial instruments, particularly those involving leverage, involves a substantial degree of risk and is not appropriate for all investors. The value of your investments can rise or fall sharply, and it is possible to lose the entirety of your invested capital. Leveraged products, in particular, amplify both potential gains and losses. Before engaging in such trading, you must assess your financial goals, experience level, and appetite for risk. It is your sole responsibility to ensure that you understand the mechanics and risks of trading, including margin requirements, and to seek independent financial advice where appropriate. Do not trade with funds you cannot afford to lose. Nothing in this site should be read or construed as constituting advice on the part of Taurex or any of its affiliates, directors, officers or employees.