The cryptocurrency market is known for its high volatility, but recent weeks have witnessed even sharper fluctuations, especially following Trump’s announcement last Sunday about establishing a U.S. strategic reserve of cryptocurrencies, which includes Cardano, Solana, Ripple, Ethereum, and Bitcoin. This move signals his strong support for the industry.
Notably, for the third consecutive week, there has been an outflow from cryptocurrency investment products, particularly due to uncertainty surrounding the tariffs imposed by Trump’s administration on several countries, including Canada, Mexico, and China. This has driven investors to exit these products and seek safe-haven assets.
Ripple (XRP) is currently the third-largest cryptocurrency by market capitalization ($145 billion), following Bitcoin ($1.8 trillion) and Ethereum ($269 billion).
Additionally, reports indicate that major investment firms have submitted applications to the U.S. Securities and Exchange Commission (SEC) for the approval of exchange-traded funds (ETFs) related to Ripple.
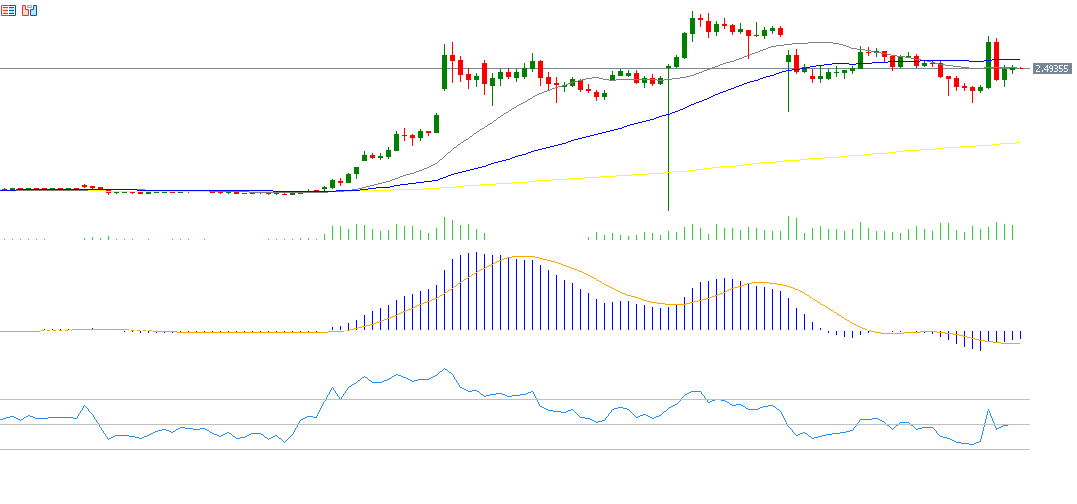
Ripple’s price surged to $3.0285 on Sunday, March 2, 2025, its highest level since February 1, 2025. It is currently trading around $2.5000. Since the beginning of the year, Ripple has gained approximately 20%, outperforming Bitcoin, which has declined by 4%, and Ethereum, which has dropped by 33%. The biggest challenge for Ripple remains reaching and surpassing the $3.4000 level, which it last achieved on January 16, 2025.
Technical Analysis: Indicators Supporting Ripple’s Uptrend
- The Relative Strength Index (RSI) is currently at 51 points, signaling bullish momentum for Ripple.
- The MACD indicator (blue line) has crossed above the Signal Line (orange line), further confirming an upward trend.
- The 20-day moving average (gray) at $2.51 is approaching the 50-day moving average (blue) at $2.71. Any bullish crossover between these two moving averages could indicate further upside potential for Ripple.
Please note that this analysis is provided for informational purposes only and should not be considered as investment advice. All trading involves risk.