
The Nasdaq 100 index recorded a new all-time high on Thursday, July 3, reaching 22,896 points. It has surged by approximately 38% from the low of 16,542 points seen on April 7, 2025, confirming the index has entered a bull market. Year-to-date, the index has climbed around 8%. However, it closed lower yesterday by about 1%, as investors cautiously await developments in the tariff situation. The tariff suspension is set to expire on Wednesday, with new tariffs taking effect on August 1, 2025.
Despite elevated valuations, expectations remain that the positive momentum in U.S. equities will continue in the coming period, especially in the following sectors:
- Technology Sector – Particularly large-cap companies tied to artificial intelligence. However, even within “Magnificent 7″, performance has varied since the beginning of the year:
- Nvidia (+18%)
- Meta (+23%)
- Microsoft (+18%)
- Amazon (+2%)
- Alphabet (-7%)
- Apple (-16%)
- Tesla (-27%)
Notably, Broadcom recently surpassed Tesla in market capitalization. Nvidia has also become the world’s most valuable company, with a market cap of $3.86 trillion, exceeding the GDP of four G7 countries: the UK, France, Italy, and Canada.
- Banking Sector – Especially large U.S. banks, which recently passed the Federal Reserve’s stress tests, reflecting strong capital and liquidity positions. The KBW Bank Index hit its highest level since January 18, 2022, last Thursday and is up around 13% year-to-date, outperforming the S&P 500.
- Industrial Sector – Expected to benefit from Trump’s new economic policies, including corporate tax cuts and mandates for companies to build manufacturing facilities within the U.S.
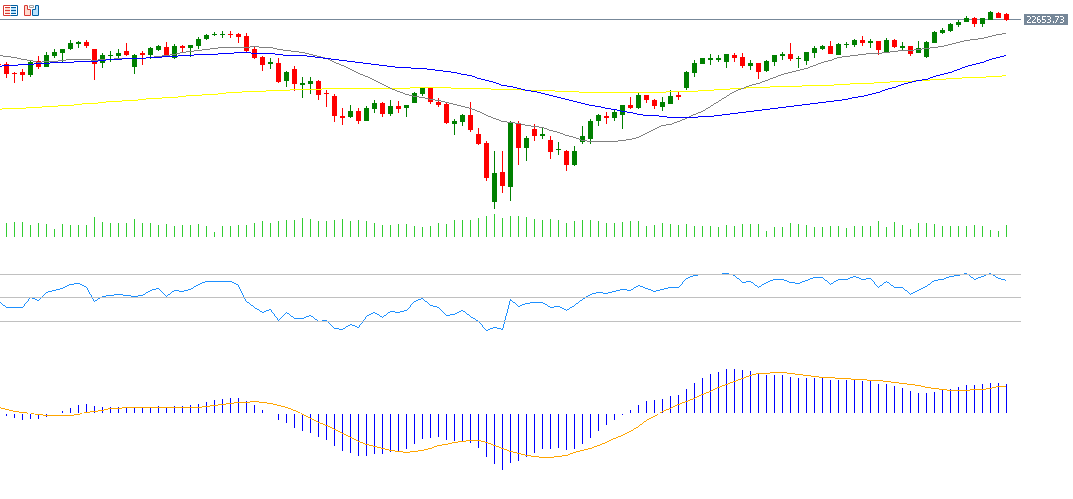
From a technical perspective, indicators support the continuation of the Nasdaq 100’s upward trend for the following reasons:
- Moving Averages Alignment – The 20-day moving average is above the 50-day, and the 50-day is above the 200-day, showing a strong bullish structure.
- Relative Strength Index (RSI) – Currently at 66, indicating strong bullish momentum.
- MACD Indicator – Shows a bullish crossover between the MACD line and the signal line, further supporting positive momentum for the Nasdaq 100.
Please note that this analysis is provided for informational purposes only and should not be considered as investment advice. All trading involves risk.


