If you already read Forex charts and use Fibonacci Retracement levels, the next step many traders take is learning to spot a Forex harmonic pattern. These are precise, geometric structures built on specific Fibonacci ratios that help you anticipate where price might reverse.
In this guide, we will walk through the most popular harmonic patterns, the exact ratios that define them, and how to plan entries, stop-losses, and targets around them.
What Is a Forex Harmonic Pattern?
A Forex harmonic pattern is a price structure made up of 5 points, usually labelled X, A, B, C, and D. Each leg connects to the next through a specific Fibonacci ratio. That’s the detail separating a genuine harmonic setup from a random zigzag on the chart.
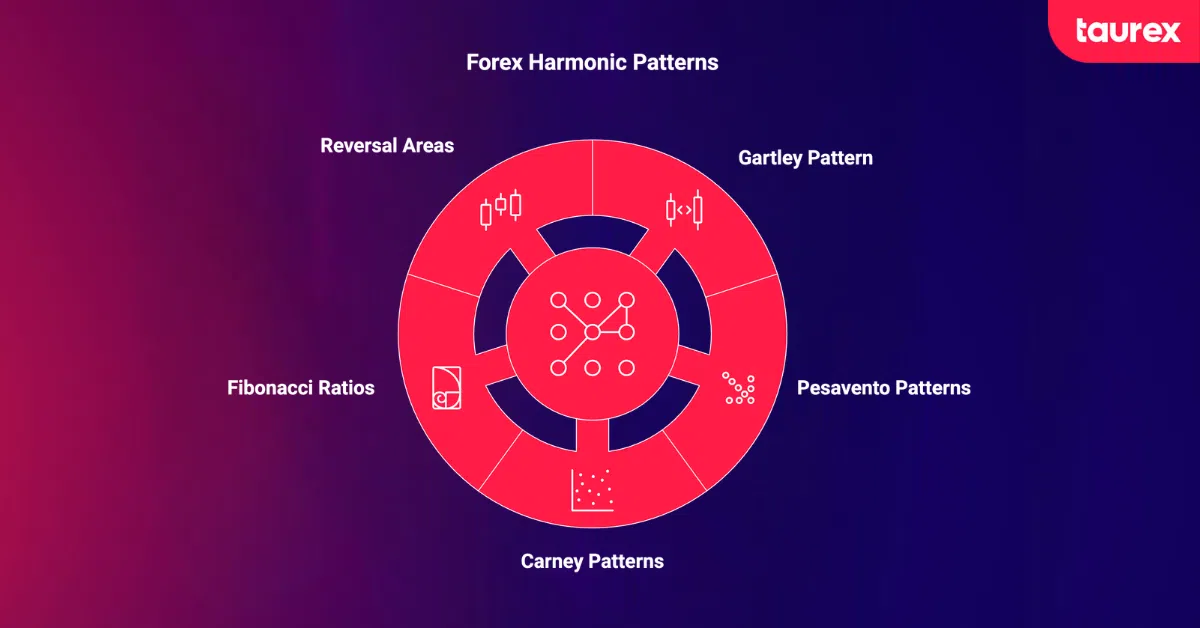
The concept traces back to H.M. Gartley, who described a five-point trading structure in his 1935 book. Larry Pesavento later refined those ideas by attaching precise Fibonacci ratios to the swings, and Scott Carney expanded the family further with the Bat, Crab, and Shark patterns.
Because harmonic trading is grounded in Fibonacci retracement and extension measurements, it gives traders a rules-based way to define potential reversal areas rather than relying on gut feel alone.
Why Forex Traders Use Harmonic Patterns
The main appeal of harmonic trading is structure. Because every pattern is defined by measurable ratios, you get a clear entry zone, a logical place for your stop-loss, and defined profit targets before you ever click a button.
A few reasons traders lean on them:
- Defined entries and exits: The completion point (D) gives you a specific area to watch rather than a vague “somewhere around here.”
- Timeframe flexibility: Harmonic patterns appear on one-minute charts and monthly charts alike, so they suit scalpers and swing traders.
- Built-in risk parameters: Since the pattern tells you where the structure would be invalidated, position sizing and risk management become more straightforward.
None of this guarantees a reversal will happen. What it does offer is a consistent framework for planning trades and staying disciplined.
What Are the Most Popular Forex Harmonic Patterns?
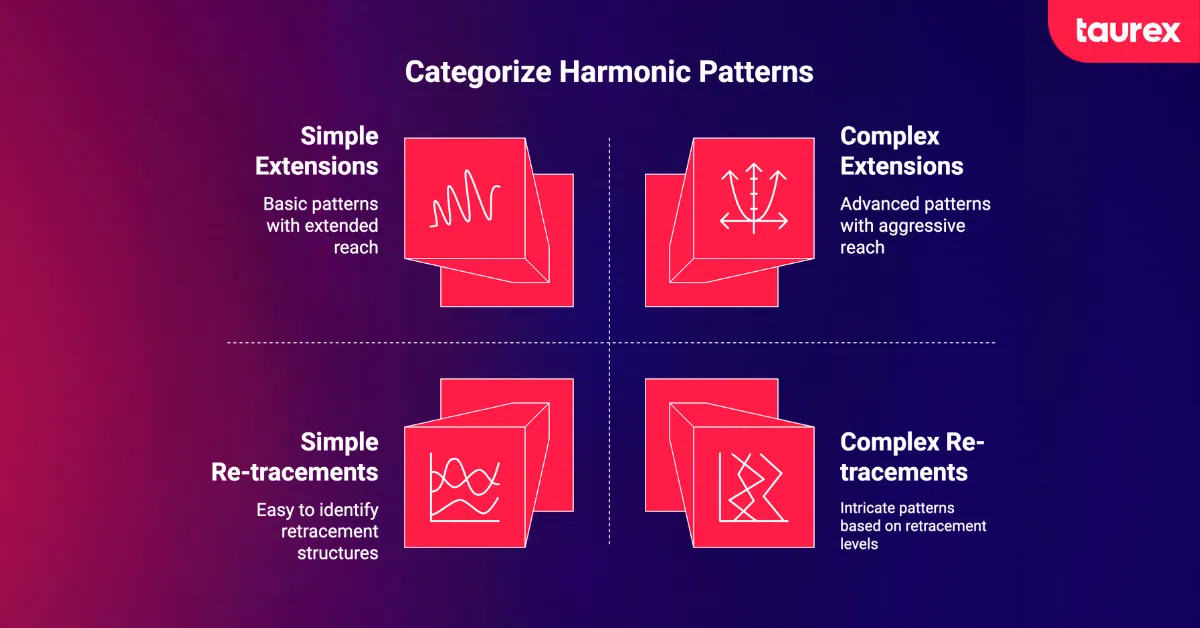
Below are eight of the most widely traded harmonic trading patterns. Each is defined by its own set of Fibonacci ratios.
Gartley Pattern
The Gartley is a retracement pattern with B at 0.618 of XA and D at 0.786 of XA. It often appears as a W or M within an existing trend and may signal continuation after the pullback ends.
Butterfly Pattern
The Butterfly is an extension pattern with B at 0.786 of XA and D extending beyond X, typically near 1.272 of XA. Its stretched final leg may signal that the existing trend is approaching exhaustion.
Bat Pattern
The Bat has a shallower B point, usually between 0.382 and 0.500 of XA, and completes at 0.886 of XA. Its compressed structure often creates a relatively narrow potential reversal zone.
Crab Pattern
The Crab is an extension pattern that completes at 1.618 of XA. Its extreme D point often appears near potential exhaustion areas, so traders commonly wait for confirmation before entering.
Deep Crab Pattern
The Deep Crab also completes at 1.618 of XA but uses a deeper B retracement at 0.886. This creates a steeper structure that can be more difficult to identify clearly.
Cypher Pattern
The Cypher completes at a 0.786 retracement of XC, while C usually extends beyond A. Its asymmetric structure makes it distinct from more traditional XABCD formations.
ABCD Pattern
The ABCD is a four-point structure in which BC retraces AB and CD approximately matches AB in length. It often appears as a smaller component within more complex harmonic patterns.
Shark Pattern
The Shark uses the points 0, X, A, B, and C and completes at C rather than D. Its reversal zone is based mainly on the 0.886 retracement and 1.13 extension measurements.
| Pattern | B Point | D Completion | Signal |
| Gartley | 0.618 of XA | 0.786 of XA | Retracement pattern that may signal trend continuation after a pullback |
| Butterfly | 0.786 of XA | Around 1.272 of XA, beyond X | Extension pattern that may signal trend exhaustion and reversal |
| Bat | 0.382 to 0.500 of XA | 0.886 of XA | Retracement pattern with a relatively narrow reversal zone |
| Crab | Usually 0.382 to 0.618 of XA | 1.618 of XA | Extension pattern that often appears near exhaustion levels |
| Deep Crab | 0.886 of XA | 1.618 of XA | More aggressive extension pattern with a steeper structure |
| Cypher | Usually 0.382 to 0.618 of XA | 0.786 of XC | Asymmetric reversal pattern that often forms after a strong price extension |
| ABCD | Not defined by a fixed B-to-XA ratio | CD roughly equals AB | Simple harmonic structure that may signal a reversal at completion |
| Shark | Usually extends beyond X | Completes at C, based on 0.886 retracement and 1.13 extension | Early reversal pattern that does not use a traditional D point |
How to Identify a Valid Forex Harmonic Pattern
The numbers above are targets, not exact requirements. In real markets, price rarely hits a ratio to the decimal, so most traders allow small tolerance bands of a few percentage points around each level.
The strongest setups appear when several ratios cluster together in the same area, forming what traders call a Potential Reversal Zone (PRZ). This is a confluence area at point D (or point C for the Shark) where multiple Fibonacci projections overlap.
A word of caution here: do not force a pattern onto the chart. If the ratios are stretched well beyond their tolerance bands, the structure is probably not a valid harmonic. A Forex harmonic pattern indicator can help you scan for setups, but the final judgment should still rest on clean, measurable ratios.
How to Trade Forex Harmonic Patterns Step by Step
Trading a harmonic pattern involves more than identifying the correct Fibonacci ratios. Traders also need a clear plan for confirming the setup, placing the stop-loss, setting profit targets, and controlling risk before entering the market.
| Step | What to Do | Key Considerations |
| 1. Find the entry point | Identify the potential reversal zone where the pattern completes. Wait for confirmation, such as a reversal candlestick, RSI divergence, or a momentum shift, before entering. | Price reaching the reversal zone does not guarantee that it will reverse. |
| 2. Place the stop-loss | For retracement patterns such as the Gartley and Bat, the stop may be placed beyond the X point. For extension patterns such as the Butterfly and Crab, it may be positioned beyond the D completion zone. | Stop placement should reflect the pattern’s invalidation level, market volatility, and the trader’s maximum acceptable risk. |
| 3. Set profit targets | Use Fibonacci retracements of the AD leg, nearby support and resistance levels, or previous swing points. Common reference levels include the 0.382 and 0.618 retracements. | Traders may take partial profit at the first target and manage the remaining position toward a second target. |
| 4. Manage risk | Calculate position size based on the distance between the entry and stop-loss. Use confirmation tools such as RSI, MACD, or divergence trading strategies to strengthen the setup. | Define the maximum acceptable loss before entering and avoid increasing risk after the trade is open. |
Forex Harmonic Patterns vs Other Technical Trading Patterns
Harmonic patterns stand out because their shape is fixed by Fibonacci ratios between labelled points. Most other patterns rely on looser geometry.
| Pattern | Structure | Typical Signal | Key Difference From Harmonic Patterns |
| Wolfe Wave | A five-wave formation built around converging or expanding channel lines and a projected target line | Potential reversal toward the estimated target | Wolfe Waves rely mainly on geometry, symmetry, and timing, while harmonic patterns require defined Fibonacci retracements and extensions. |
| Rising Wedge | Two upward-sloping trendlines that gradually converge | Potential bearish reversal | A rising wedge has no fixed XABCD structure or required Fibonacci ratios, making its geometry less restrictive. |
| Bull Flag | A short consolidation channel that forms after a strong upward move | Bullish continuation | A bull flag is based on trend direction, parallel boundaries, and momentum rather than measured Fibonacci relationships between swing points. |
| Megaphone Pattern | Two diverging trendlines that create an expanding trading range | Increasing volatility and a possible breakout or reversal | A megaphone pattern is identified through widening price swings, while harmonic patterns use ratio-defined legs and a specific potential reversal zone. |
Bearish vs Bullish Harmonic Patterns: What Is the Difference?
Every harmonic pattern has both a bullish and a bearish version, and the difference comes down to direction.
| Feature | Bullish Harmonic Pattern | Bearish Harmonic Pattern |
| Initial XA leg | Moves upward from X to A | Moves downward from X to A |
| Pattern orientation | Forms an M-like structure | Forms a W-like structure |
| Completion point | Completes at D near a potential support or reversal zone | Completes at D near a potential resistance or reversal zone |
| Expected price movement | Price may reverse upward after reaching D | Price may reverse downward after reaching D |
| Potential trade setup | Possible long position after bullish confirmation | Possible short position after bearish confirmation |
| Fibonacci ratios | Uses the same ratios as the bearish version | Uses the same ratios as the bullish version |
| Main difference | The pattern is oriented toward a potential upward reversal | The pattern is oriented toward a potential downward reversal |
- A bullish pattern forms with the XA leg moving upward and completes at a D point where price may turn higher, offering a potential long setup.
- A bearish pattern is the mirror image. The XA leg moves down, and completion at D suggests price may turn lower for a possible short. The Fibonacci ratios stay identical in both cases; only the orientation on the chart flips.
What Are the Most Common Mistakes Traders Make With Forex Harmonic Patterns?
Even experienced traders slip up with harmonics. A few recurring errors are worth watching for:
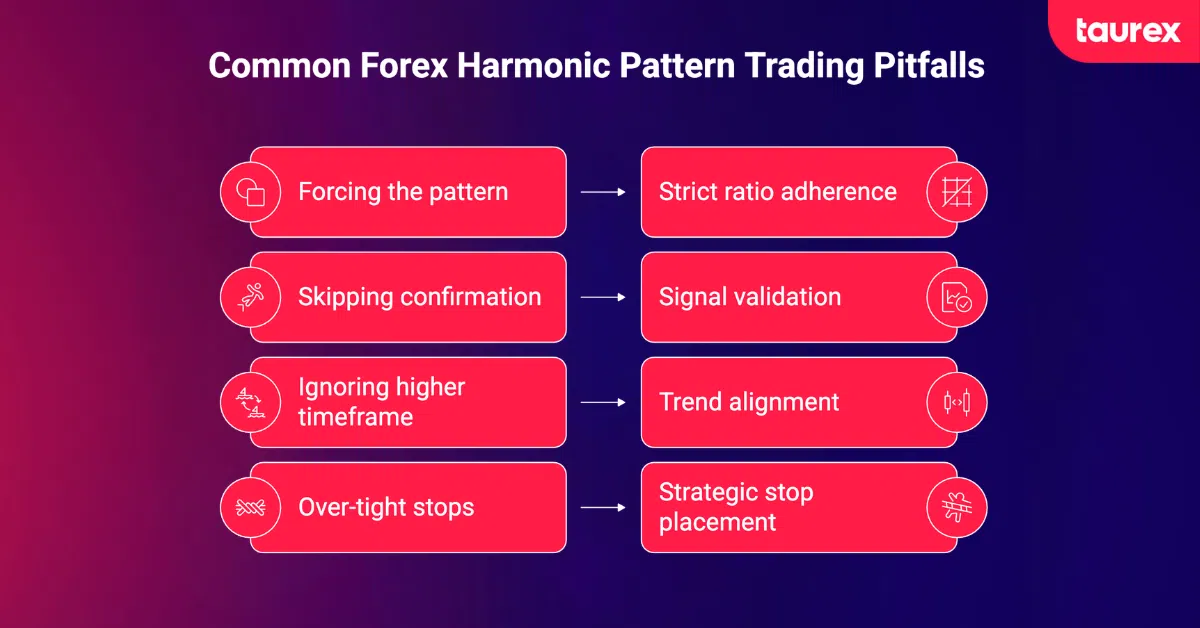
- Forcing the pattern: Bending the ratios to make a setup “fit” leads to unreliable trades.
- Skipping confirmation: Entering the moment price touches the PRZ, without any candlestick or momentum signal, often leads to premature entries.
- Ignoring the higher timeframe: A clean pattern against a strong trend can be less dependable than one aligned with it.
- Over-tight stops: Placing a stop right at the D point, with no buffer, can get you knocked out on normal noise.
Best Practices for Trading Forex Harmonic Patterns
To trade harmonics with more discipline, keep these habits in mind:
- Wait for confluence: Prioritise setups where multiple ratios stack in the same PRZ.
- Confirm before entering: Use reversal candles, RSI, or MACD signals as a second opinion.
- Respect the tolerance bands: Allow a small margin around each ratio, but do not stretch it.
- Keep a trading journal: Logging your harmonic trades helps you refine which patterns and pairs work best for your style.
- Practise first: Testing setups on a demo account lets you build familiarity without risk before going live.
Platforms like Taurex offer advanced charting and Fibonacci tools across MT4 and MT5, which makes plotting and reviewing these patterns more manageable for traders of all levels.
Final Thoughts
Forex harmonic patterns give technical traders a structured, rules-based way to spot potential reversal areas using Fibonacci ratios. The strength of the method lies in its precision, but that same precision demands patience and confirmation.
No harmonic setup is a sure thing, so pair it with solid risk management and a clear trading plan. Learn the ratios, respect the structure, and take charge of your trading one well-planned setup at a time.
Disclaimer: Trading forex and CFDs carries significant risk, including the potential loss of capital. This article is for educational purposes only and does not constitute financial advice. Past performance does not guarantee future results. Always conduct your own research and consider your risk tolerance before trading.
FAQ
What Is a Forex Harmonic Pattern?
A Forex harmonic pattern is a five-point price structure defined by specific Fibonacci ratios between its legs, used to identify areas where price may reverse.
Which Harmonic Pattern Is the Most Reliable?
Reliability is contested and varies by market and timeframe. Many traders favour the Gartley and Bat for their tighter ratios, but no pattern works consistently without confirmation.
What Fibonacci Ratios Are Used in Harmonic Trading?
The most common ratios include 0.382, 0.500, 0.618, 0.786, 0.886, 1.272, and 1.618, applied to retracements and extensions of the pattern’s legs.
What Is the Difference Between the Gartley and Butterfly Patterns?
The Gartley is a retracement pattern completing at 0.786 of XA. The Butterfly is an extension pattern, with D reaching 1.272 or 1.618 of XA instead, well past the origin point.
How Do You Identify a Valid Harmonic Pattern?
Measure each leg with Fibonacci tools, check that the ratios fall within their tolerance bands, and look for confluence at the potential reversal zone.
Are Harmonic Patterns Suitable for Beginners?
They can be, though they require comfort with Fibonacci measurement first. Beginners often benefit from practising on a demo account before trading them live.
Which Timeframe Works Best for Harmonic Patterns?
Harmonics form on any timeframe. Higher timeframes like the four-hour and daily tend to produce cleaner, more dependable setups with less noise.
Can Harmonic Patterns Be Used Without Indicators?
Yes. The patterns rely on Fibonacci ratios and price structure, so they can be traded manually, though many use a harmonic pattern indicator to speed up scanning.
How Accurate Are Forex Harmonic Patterns?
Accuracy claims vary widely and are debated across sources. Harmonics tend to perform best when paired with confirmation tools and confluence instead of being traded on their own.
What Is a Potential Reversal Zone (PRZ)?
The PRZ is the area at point D, or point C for the Shark, where several Fibonacci projections cluster together, marking where a reversal is anticipated.