

The forex rising wedge pattern is one of the most misleading formations a trader can meet on a price chart. At first glance, the price looks like it is trending higher, a steady sequence of rising highs and rising lows that resembles a healthy uptrend. The structure underneath, however, tells a very different story.
This pattern often signals that bullish momentum is fading even while the price is still climbing. That is exactly why so many traders get trapped in false continuation setups right before a sharp reversal.
This guide breaks down how the rising wedge forms, what it reveals about market psychology, how to identify it correctly, and how traders apply it in real rising wedge trading strategies using proper confirmation tools and a Forex trading platform.
What Is a Rising Wedge Pattern?
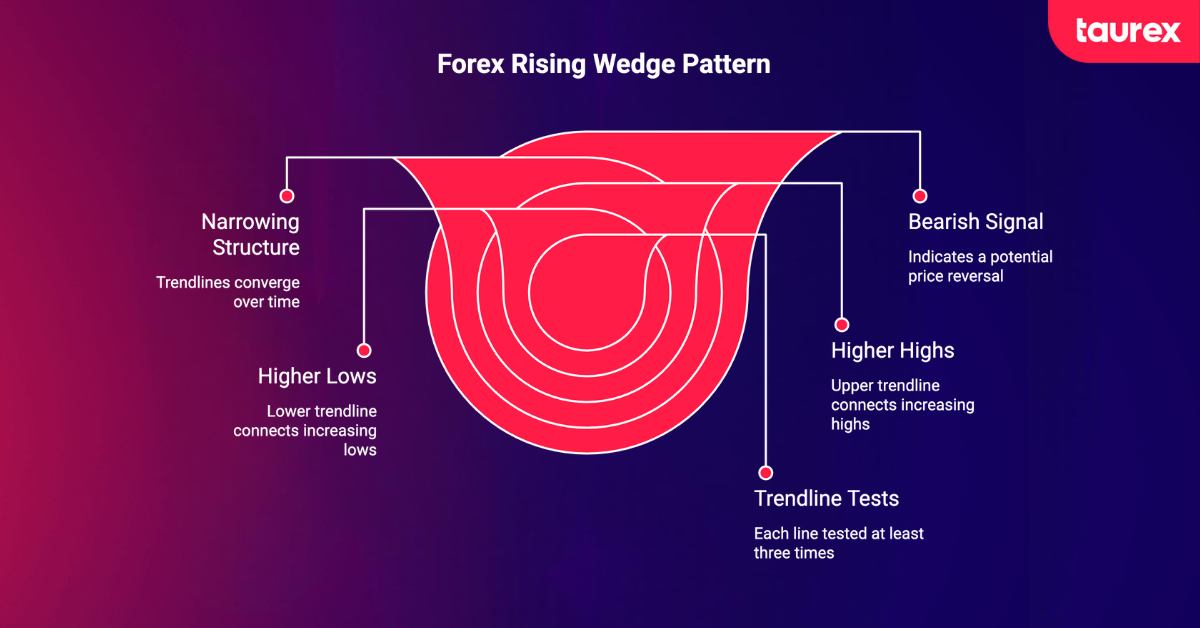
A forex rising wedge pattern is a technical chart formation created by two upward-sloping trendlines that gradually move closer together. The upper line connects a series of higher highs, while the lower line connects higher lows. Over time, the structure narrows because the lower trendline rises more quickly than the upper one.
Even though the price is moving upward, the rising wedge is generally seen as a bearish signal. It often appears near the end of an uptrend, where it can signal a potential reversal, but it can also form during temporary pullbacks within a broader downtrend.
Research based on Tom Bulkowski’s pattern studies suggests the formation has an 81% success rate in bull markets, with downside breakouts occurring around 60% of the time.
For the structure to be considered valid, each trendline should typically be tested at least three times. (See Bulkowski’s published chart-pattern statistics for the original data set.)
How the Forex Rising Wedge Pattern Forms
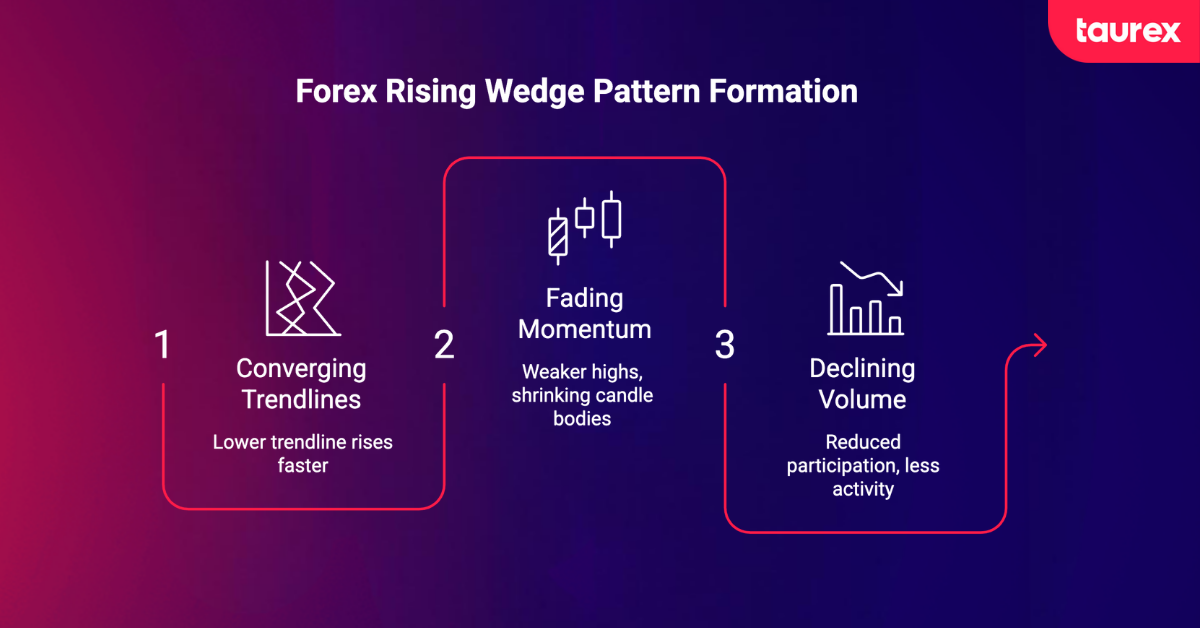
The rising wedge develops gradually and reflects weakening bullish momentum even while the price continues to rise.
- It begins with two upward-sloping trendlines: the upper line connecting higher highs and the lower line connecting higher lows. Unlike a channel, the lines converge because the lower trendline climbs faster, tightening the structure over time.
- As the pattern forms, momentum begins to fade. Each new high is usually weaker than the last, and candle bodies often shrink as price moves toward the tip of the wedge. Buyers are still active, but they are losing control.
- Volume usually declines during this phase, showing reduced participation rather than stable consolidation. This gradual drop in activity is often the earliest warning that the move is running out of strength.
- The pattern completes when the price breaks below the lower trendline, often with a sharp move and increased volume. A retest of the broken trendline is also common, where it acts as resistance before the price continues lower.
What Is the Market Psychology Behind the Rising Wedge Pattern?
The rising wedge reflects a gradual shift in control from buyers to sellers. While price continues to move higher, momentum weakens beneath the surface.
Why Buyers Begin Losing Control
Early in the formation, buyers are still dominant and continue pushing prices upward. However, sellers begin to enter at slightly lower levels each time, which creates the rising lower trendline. At the same time, buying pressure fades even though the trend still appears intact visually.
The Role of Profit-Taking
As the price climbs, traders who entered earlier start locking in profits near resistance. This steady selling adds pressure to the market, but it is absorbed through small pullbacks, which keep the structure looking orderly while gradually weakening the uptrend.
How Sellers Gain Momentum
As the wedge narrows, fewer buyers are willing to enter at higher prices. The balance slowly shifts toward sellers without any sharp warning. Once the lower trendline breaks, stop-loss orders are triggered, and new short positions often accelerate the downside move.
How to Identify a Rising Wedge Pattern on Forex Charts
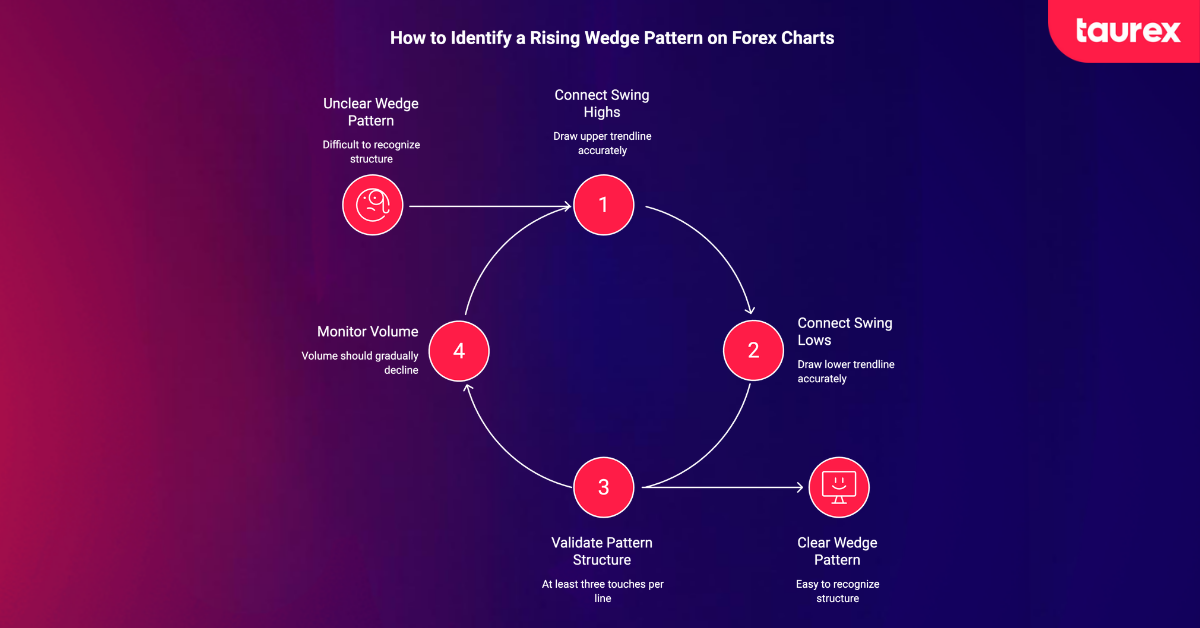
Spotting a rising wedge comes down to drawing accurate trendlines and confirming that the structure is actually narrowing over time. When the structure is clean, the pattern becomes much easier to recognise.
Drawing The Trendlines Correctly
Connect at least two swing highs for the upper trendline and two swing lows for the lower trendline. With an ascending wedge pattern, both lines slope upward, but the lower trendline should rise more steeply, tightening the structure as the price develops.
On Taurex, traders can draw and adjust trendlines directly on MT4 and MT5 charts, which makes it easier to spot this compression in real time. For traders still building confidence with chart reading, a guide on how to read Forex charts can help reinforce the basics.
Validating The Pattern Structure
A valid rising wedge usually has at least three touches on each trendline. As the pattern forms, volume should gradually decline while price continues to print higher highs and higher lows within the narrowing range. Most wedges develop over several trading sessions, often around 10 to 50 candles, depending on the timeframe.
Common Mistakes When Identifying Rising Wedges
One common mistake is confusing a rising wedge with an ascending channel. Channels have parallel trendlines, while wedges converge as the price moves forward. Another mistake is entering too early before the structure is fully formed, especially when there are fewer than three confirmed touches on each side.
Ignoring volume is another issue that often leads to weak or false signals. Be aware that a widening Forex spread during low-liquidity periods can also distort the appearance of trendline touches, making support or resistance look more significant than it actually is.
Best Timeframes for Rising Wedge Trading
Rising wedges are more reliable on higher timeframes, such as H4 and daily charts, where market noise is reduced, and price structure is clearer. Lower timeframes often produce distorted versions that are far less dependable.
Switching between H4 and daily views on Taurex makes it easy to confirm the pattern across multiple perspectives before acting.
How to Trade the Forex Rising Wedge Pattern
Rising wedge setups can be traded in different ways depending on how aggressive or conservative you want to be. The key is to match the entry style with your risk tolerance and confirmation approach.
1. Breakout Trading Strategy
The most direct approach is to enter short when the price closes below the lower trendline. This confirms that the structure has broken and selling pressure is taking control.
Stops are usually placed above the most recent swing high inside the wedge. A common way to set targets is to measure the height of the wedge at its widest point and project that distance downward from the breakout. Familiarity with opening range breakout principles can be useful here, as the same logic of waiting for a decisive level break before committing to a direction applies equally to wedge breakouts.
This projection method helps define realistic downside objectives. On trading platforms like Taurex, fast execution on MT4 and MT5 allows traders to react quickly once the breakout confirms, which is important in momentum-driven moves.
2. Retest Entry Strategy
A more conservative approach is to wait for the price to retest the broken trendline. If the level holds as resistance and price is rejected, this provides a cleaner short entry with a tighter stop and improved risk-to-reward ratio. Traders who favour pullback trading strategies will find this retest approach especially natural, as it uses the same principle of waiting for the price to return to a broken level before entering in the direction of the new trend.
3. Trend Reversal Strategy
When a rising wedge forms after a strong uptrend, the breakout can signal a broader trend reversal rather than just a short-term pullback. In this case, traders often target deeper support zones below the pattern and use a higher timeframe structure to confirm that bearish momentum is developing.
Incorporating Forex news trading strategies into this approach can add an extra layer of context, since a high-impact fundamental release near the breakout point can either accelerate the reversal or temporarily override the technical signal.
4. Multi-Timeframe Confirmation Strategy
This approach starts with identifying the wedge on a higher timeframe, such as the daily chart, then refining entries on the H4 chart. On the lower timeframe, traders look for additional confirmation such as bearish candlestick signals, RSI divergence, or MACD crossovers. Using multiple timeframes helps filter weaker breakouts and improves overall trade quality.
How to Confirm a Rising Wedge Breakout
A rising wedge breakout should always be confirmed using multiple signals rather than relying on price alone.
- Volume confirmation: Volume should decline during the wedge formation, showing fading buying pressure. A valid breakout is usually supported by a noticeable spike in volume, while weak volume breakouts are more likely to fail. Traders who use the VWAP indicator can check whether the price on the breakout candle closes below the session VWAP, which adds further weight to the case for downside follow-through.
- RSI confirmation: Bearish divergence, where price forms higher highs but RSI forms lower highs, signals weakening momentum. Confirmation strengthens when RSI drops below 50 after the breakout.
- MACD confirmation: A bearish MACD crossover during or shortly after the breakout supports downside momentum. A move of the histogram into negative territory adds further confirmation.
- Support and resistance confirmation: Breakouts at key support are more reliable, and broken support often flips to resistance on a retest. A price gap below the lower trendline can signal especially strong selling conviction.
Rising Wedge vs Other Forex Chart Patterns
Knowing what a rising wedge is not matters just as much as knowing what it is. Several formations can look similar at first glance but carry very different signals.
The rising wedge is sometimes also called an ascending wedge pattern because both trendlines slope upward as the structure narrows. However, traders should not confuse it with an ascending triangle, which has flat resistance and usually points to a different market setup.
Rising Wedge vs Ascending Triangle
| Feature | Rising wedge | Ascending triangle |
| Structure | Two converging upward-sloping trendlines | Flat resistance with rising support |
| Market behavior | Price rises, but momentum weakens | Price builds pressure under resistance |
| Signal type | Bearish reversal or breakdown | Bullish continuation |
| Key difference | Converging structure signals exhaustion | Flat resistance signals accumulation for upside breakout |
Rising Wedge vs Bullish Channel
| Feature | Rising wedge | Bullish channel |
| Structure | Converging upward trendlines | Parallel upward trendlines |
| Market behavior | Momentum fades as price tightens | Steady, controlled uptrend |
| Signal type | Bearish reversal or breakdown | Bullish continuation |
| Key difference | Compression signals weakening trend | Parallel movement signals a healthy trend |
Rising Wedge vs Falling Wedge
| Feature | Rising wedge | Falling wedge |
| Structure | Converging upward trendlines | Converging downward trendlines |
| Market behavior | Rising price with weakening momentum | Falling price with weakening momentum |
| Signal type | Bearish reversal | Bullish reversal |
| Key difference | Breaks downward after uptrend exhaustion | Breaks upward after downtrend exhaustion |
Common Mistakes Traders Make With Rising Wedge Patterns
Even a well-defined rising wedge can lead to poor trades if it is misread or traded too early. Most losses come from ignoring structure, context, or confirmation signals rather than the pattern itself.
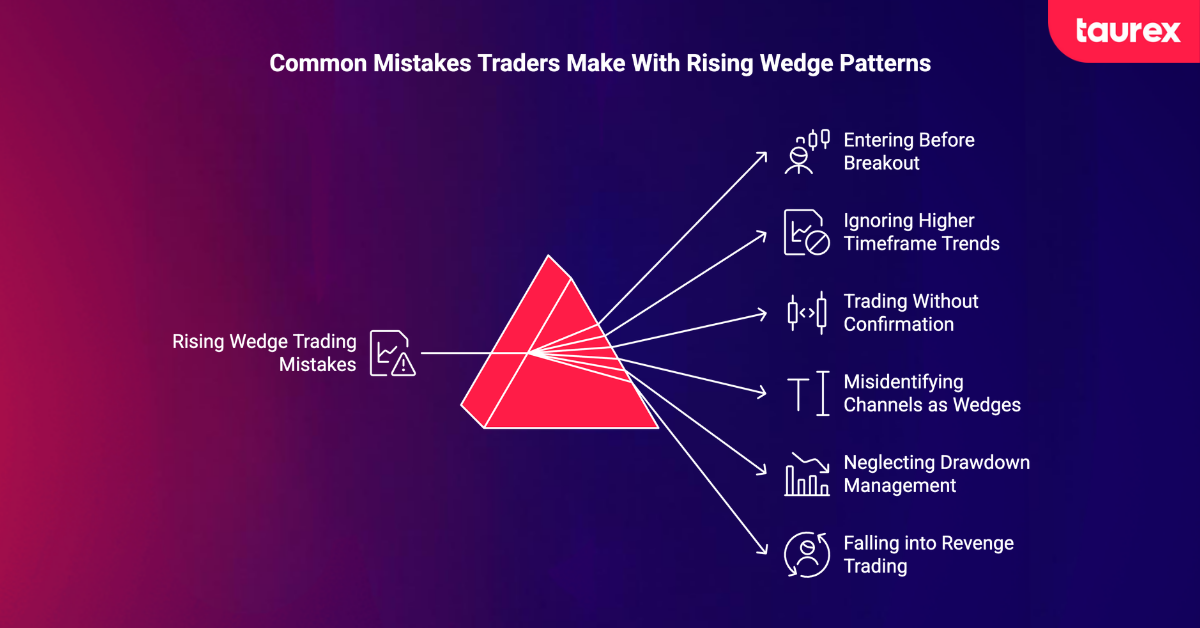
- Entering before the breakout: Trading inside the wedge means acting before confirmation. Wait for a clear candle close below the lower trendline before entering; you risk getting caught in normal price movement.
- Ignoring higher timeframe trends: A rising wedge against a strong higher timeframe uptrend has a lower chance of producing a sustained breakdown. Always check the broader trend before treating the pattern as valid.
- Trading without confirmation: The pattern alone is not enough for a trade decision. Volume, RSI divergence, or MACD signals should align with the breakout. Without confirmation, the probability of a false breakout increases significantly.
- Misidentifying channels as wedges: A channel has parallel trendlines, while a wedge has converging lines with the lower line rising more steeply. Confusing the two can completely distort your trade bias.
- Neglecting drawdown management: A string of false breakouts can erode capital quickly. Monitoring your Forex drawdown across rising wedge trades helps you identify when the pattern is underperforming in current conditions and adjust your position sizing accordingly.
Advantages and Limitations of the Forex Rising Wedge Pattern
The rising wedge is a popular chart pattern because it offers clear structure and actionable trade levels. However, like all technical setups, it has strengths and weaknesses that traders need to understand before relying on it.
| Advantages | Limitations |
| Clear structure with defined entry, stop, and target levels | False breakouts are common, especially in low-volume conditions |
| Offers favourable risk-to-reward setups, often up to 3:1 | Less reliable in highly volatile or strongly trending markets |
| Works across Forex, stocks, crypto, and commodities | Requires practice to identify correctly; misreading is common |
| Can signal both reversals and continuations depending on context | News events and fundamentals can override the technical pattern |
| Provides structured trade planning (breakout and retest setups) | Performance varies significantly across different market conditions |
Taurex provides access to a wide range of Forex pairs, giving traders more opportunities to find well-formed rising wedge setups across different market conditions.
Final Thoughts
The rising wedge can look deceptively bullish, but when it is properly formed and confirmed, it often signals a strong bearish reversal. Waiting for a clear trendline structure, checking volume, and confirming momentum with indicators helps turn the pattern into a structured trading setup rather than a guess.
At Taurex, traders can apply these concepts using advanced charting tools and real-time market data. A free demo account allows you to practise identifying rising Forex wedge patterns in live conditions without risking capital, helping you build confidence before moving to a live account.
When you are ready, open a Taurex demo account and start testing rising wedge setups in real market conditions.
FAQ
What is a Forex rising wedge pattern?
A Forex rising wedge pattern is a bearish chart formation made up of two converging upward-sloping trendlines. Despite the price moving higher during its formation, it signals weakening buying momentum and often precedes a downside breakout. The breakout occurs downward in roughly 60% of cases.
Is a rising wedge pattern bullish or bearish?
A rising wedge is primarily a bearish pattern. Even though price continues to rise during its formation, the narrowing structure and declining momentum suggest buyer exhaustion, with most breakouts resolving to the downside.
How reliable is the rising wedge pattern in Forex?
The rising wedge shows strong reliability when properly confirmed. Research by Tom Bulkowski suggests an 81% success rate in bull markets, while broader backtesting shows lower average performance without confirmation. Reliability improves significantly on higher timeframes, such as the daily chart.
How do you trade a rising wedge breakout?
Wait for a confirmed candle close below the lower trendline. Enter short on the breakout, place a stop above the last swing high within the wedge, and project your target by measuring the height of the pattern and extending it downward from the breakout point.
What indicators work best with a rising wedge pattern?
RSI, MACD, and volume are the most effective confirmation tools. RSI divergence and a drop below 50 indicate weakening momentum, MACD bearish crossovers confirm trend shifts, and a breakout supported by rising volume increases reliability.
What is the difference between a rising wedge and an ascending triangle?
An ascending triangle has a flat resistance level with rising support, which is typically a bullish continuation pattern. A rising wedge has two converging upward-sloping trendlines, which more often signal a bearish reversal.
What timeframe works best for rising wedge trading?
The H4 and daily timeframes offer the most reliable signals. They reduce market noise, align better with institutional flow, and produce higher-quality wedge formations compared to lower timeframes.
Can a rising wedge pattern fail?
Yes, rising wedges can fail, especially in low-volume markets or during major fundamental news events. These false breakouts occur when the price briefly breaks the trendline before reversing. Using confirmation tools helps reduce, but not eliminate, this risk.

