
Last week saw significant global economic developments. In the United States, the unemployment claims index dropped to 211,000, indicating stability in the labor market, while U.S. oil inventories fell more than expected. Pending home sales increased by 2.2%, surpassing expectations, while the manufacturing PMI contracted slightly despite exceeding forecasts. In the Eurozone, the UK, and Australia, industrial activity indicators showed a decline, whereas China reported mixed results, with the manufacturing PMI decreasing, but the non-manufacturing PMI rising, reflecting relative stability in the services sector.
Market Analysis
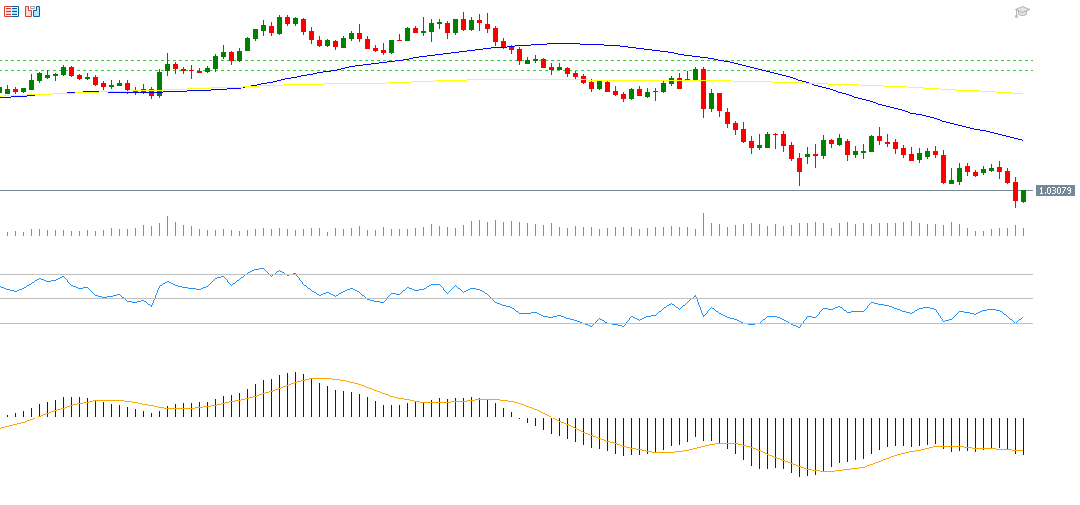
EUR/USD Pair
The EUR/USD exchange rate reached 1.0224 on Thursday, January 2, 2024, marking its lowest level since November 21, 2022. It has fallen by around 9% from the peak of 1.1214 on September 25, 2024, to the low of 1.0224 on November 21. The negative momentum for the EUR/USD pair seems dominant in the near term due to factors such as weak economic data, political challenges in the Eurozone (especially in Germany and France), and the strength of the U.S. dollar. The Relative Strength Index (RSI) currently stands at 35, indicating bearish momentum. The MACD shows a downward crossover between the blue MACD line and the orange Signal Line, providing further bearish momentum for the EUR/USD pair.
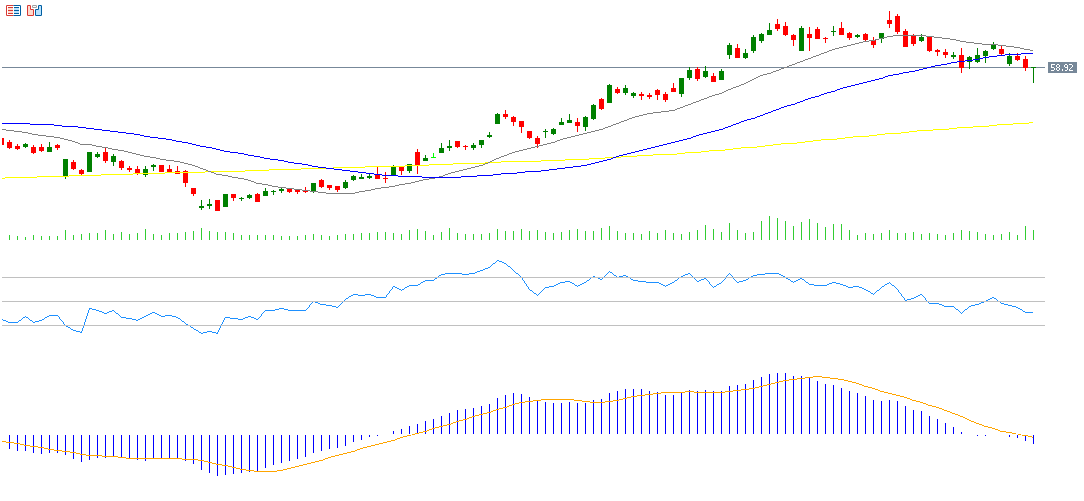
Delta Air Lines
Delta Air Lines stock rose by approximately 51% last year, closing at $59.00 on Friday, January 3, 2025. The market is looking forward to Delta’s Q4 earnings announcement on Friday, January 10, 2025, with expected earnings per share (EPS) of $1.75, up from $1.28 in the previous reading. Revenue expectations are at $14.13 billion, compared to $13.70 billion previously. The RSI for Delta currently stands at 40, indicating bearish momentum. The MACD shows a downward crossover between the blue MACD line and the orange Signal Line, providing further negative momentum for Delta.
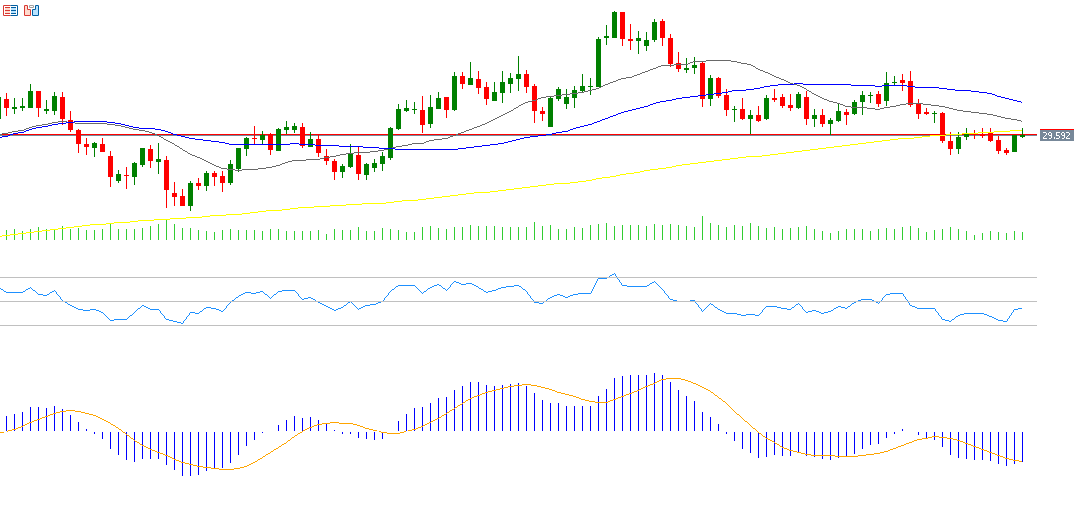
Silver
Silver prices have risen by about 2.5% since the beginning of 2025, currently hovering around $30. Several factors are influencing silver, primarily the rise in gold prices and expectations of continued U.S. interest rate cuts this year. The RSI currently stands at 44, suggesting bearish momentum. The MACD shows convergence between the blue MACD line and the orange Signal Line, with any bullish crossover potentially indicating positive momentum for silver.
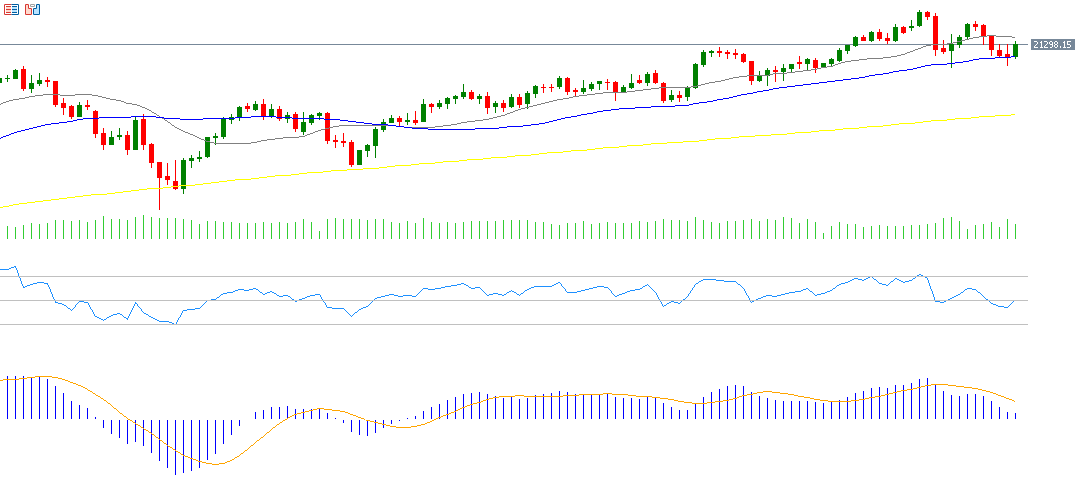
Nasdaq 100
The Nasdaq 100 index rose by 26% at the beginning of last year, driven particularly by the “Magnificent 7” stocks, along with Broadcom. The RSI for Nasdaq 100 currently stands at 51, signaling the beginning of positive momentum. However, the MACD shows a downward crossover between the blue MACD line and the orange Signal Line, suggesting bearish momentum for Nasdaq 100.
Key Events This Week
Markets are anticipating several important economic indicators and data releases this week:
- Today, the Caixin Services PMI in China, along with the Services PMIs in Australia, Japan, the Eurozone, the UK, and the U.S., will be released, in addition to factory orders in the U.S.
- On Tuesday, Australia’s building permits, consumer price indices in Switzerland and the Eurozone, China’s foreign exchange reserves, the UK construction PMI, and the U.S. job openings and ISM non-manufacturing PMI will be closely monitored.
- On Wednesday, the ADP non-farm private employment change, U.S. oil inventories, and the Federal Open Market Committee meeting minutes will be released.
- On Thursday, retail sales data from Australia and the Eurozone, along with China’s consumer and producer price indices, will be published.
- Finally, on Friday, Japan’s household spending, new loans in China, U.S. non-farm payrolls, unemployment rate, average hourly earnings, and the University of Michigan consumer sentiment index will be released, along with Canada’s employment and unemployment change rates.
Please note that this analysis is provided for informational purposes only and should not be considered as investment advice. All trading involves risk.


