By Samir Al Khoury,
Japan’s Financial Markets Under Pressure: Key Drivers and Trends
The financial markets in Japan have recently experienced significant volatility, driven by economic uncertainty and unclear monetary policies in both Japan and the United States. Last week, the Bank of Japan unexpectedly raised interest rates to 0.25%, contrary to market expectations that they would remain unchanged. Deputy Governor Shinichi Uchida stated yesterday that the central bank does not plan to raise interest rates in the near future due to ongoing market volatility.
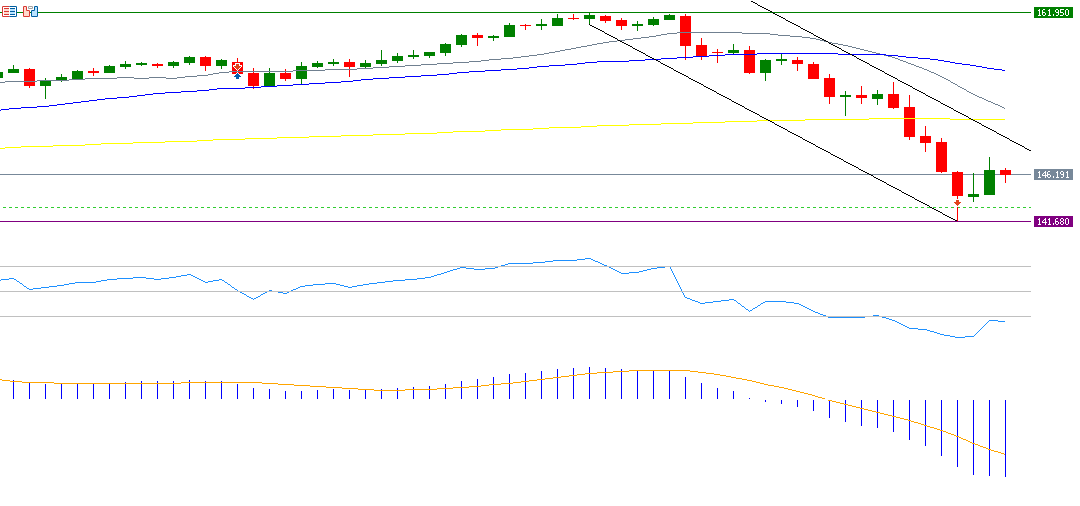
The US dollar fell to 141.68 against the Japanese yen on Monday, 5 August 2024, its lowest level since 2 January 2024, after having reached 161.95 on 3 July 2024, the highest level since 1990. The dollar-yen exchange rate is currently hovering around 146.
There is a clear positive correlation between the Nikkei 225 index and the USDJPY pair; the strength of the yen against the dollar (i.e., the decline in the dollar against the yen) reduces the attractiveness of Japanese stocks for investors holding foreign currencies. After reaching an all-time high of 42,426 points on 11 July 2024, the Nikkei 225 index came under selling pressure and fell to 31,156 points on Monday, 5 August 2024, its lowest level since 24 October 2023. The index closed yesterday at 34,831 points.
Regarding Japanese bonds, despite the narrowing spread between Japanese and US bond yields, the gap remains relatively wide. For example, the yield on 10-year Japanese government bonds is currently 0.85%, while the yield on US Treasury bonds stands at 3.91%, creating a gap of approximately 3.06%. This spread encourages carry trades, which in turn puts downward pressure on the yen.
The USDJPY pair is hovering around the 146 level, with technical indicators suggesting a bearish outlook. For instance, the DMI+ is around 10 points, while the DMI- is at approximately 40 points, indicating strong selling pressure on the pair. Additionally, the ADX is around 49 points, signalling strong downside momentum. The RSI is around 26 points, indicating that the pair is in the oversold zone, reflecting the negative momentum of the USDJPY pair.
Please note that this analysis is provided for informational purposes only and should not be considered as investment advice.
Taurex is the trading name of Zenfinex Global Limited, Stochastic Africa SL Ltd, Zenfinex Global LLC, and Zenfinex Limited.
Zenfinex Global Limited is registered in the Republic of Seychelles with registration number: 8428731-1 and is regulated by the Financial Services Authority of Seychelles (license number SD092). Its registered office address is F20, 1st Floor, Eden Plaza, Eden Island, Seychelles.
Stochastic Africa (SL) Limited is a company registered in Sierra Leone with Company Number: SL270319STOCH05271 and is licensed by the Bank of Sierra Leone under license number BSL/SAL/2023 and with the registered office at 148D Wilkinson Road, Freetown, Sierra Leone.
Zenfinex Global LLC is a company registered with the Financial Services Authority in Saint Vincent and the Grenadines under registered number 138 LLC 2019. Its registered office is Hinds Building, Kingstown, Saint Vincent, and the Grenadines.
Zenfinex Limited is a company registered in England and Wales under registered number: 11077380. Authorised and regulated by the Financial Conduct Authority under firm reference number 816055. Its registered office is 4th Floor, 4 Eastcheap, London, EC3M 1AE, United Kingdom.
*All trading involves risk.