
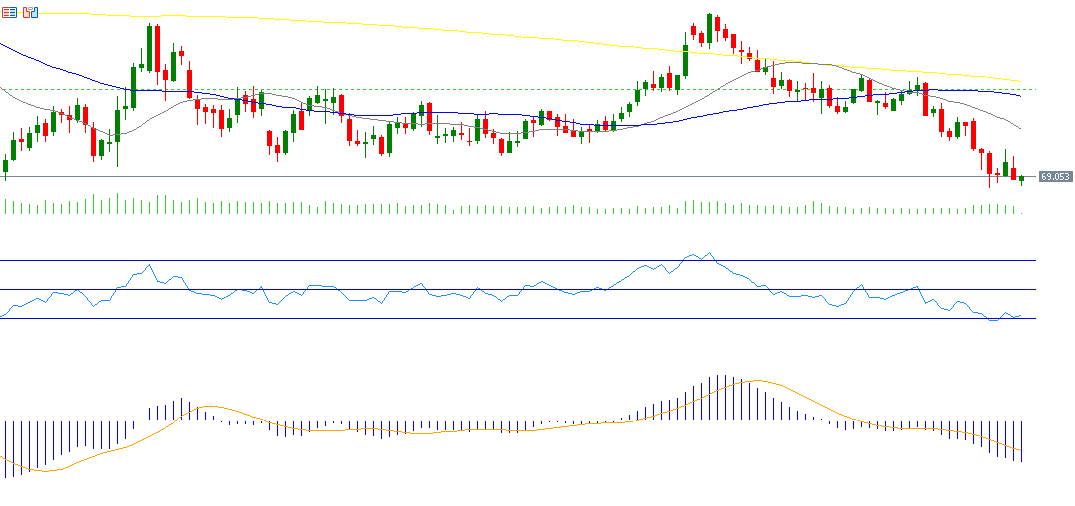
Oil prices dropped to $68.37 on Wednesday, March 5, 2025, marking their lowest level since December 2021, currently trading near $70. Oil prices have declined by approximately 6% since the beginning of the year, amid prevailing uncertainty in the oil market, which is influenced by various factors.
The decline is attributed to several key factors, including:
• Market oversupply.
• Concerns over a potential economic recession in the United States, especially with the recent slowdown in some U.S. economic indicators, such as the labor market and inflation, in addition to Trump’s statement that the U.S. economy is undergoing a transitional period.
• The gradual resumption of oil production by the OPEC+ group starting in April.
• Tariffs imposed by Trump on certain countries such as Canada, Mexico, and China.
• A rise in U.S. oil inventories, which increased by approximately 3.614 million barrels, exceeding expectations (0.600 million) and the previous reading (-2.332 million).
• Weak economic data from China, such as the annual Consumer Price Index (CPI), which contracted by 0.7% in February, marking its lowest level in 13 months, along with continued contraction in the Producer Price Index (PPI), which recorded -2.2% in February.
From a technical perspective, crude oil prices are currently trading below the 50-day moving average (blue) at $75.65 and below the 20-day moving average (gray) at $72.93. Additionally, the bearish crossover or “death cross” remains in place between the 20-day and 50-day moving averages, which may indicate a continued downward trend in crude oil prices.
As for the Relative Strength Index (RSI), it currently stands at 33 points, signaling bearish momentum for oil prices. Moreover, the MACD indicator shows the blue line below the signal line (orange), further reinforcing the continuation of negative momentum in crude oil prices.
Please note that this analysis is provided for informational purposes only and should not be considered as investment advice. All trading involves risk.