
Last week saw the release of mixed economic data globally. In the United States, crude oil inventories declined by less than expected, while the Producer Price Index came in below forecasts despite remaining higher than the previous reading. Meanwhile, manufacturing indicators such as the Philadelphia Fed Manufacturing Index and the Empire State Manufacturing Index showed notable improvement, alongside a decline in initial jobless claims. However, industrial production contracted and existing home sales declined. In the Eurozone, annual inflation rose to 2.6%, accompanied by a slight improvement in industrial production. In the United Kingdom, data showed stronger monthly economic growth and retail sales despite continued weakness in industrial output. In Switzerland, producer prices recorded a modest monthly increase. In Australia, the unemployment rate remained stable while employment growth slowed. In Japan, industrial production contracted on a monthly basis. In China, the data presented a mixed picture, as first-quarter GDP growth exceeded expectations, supported by stronger industrial production, while retail sales and fixed-asset investment slowed. At the same time, housing prices continued to decline, the unemployment rate increased, and export growth slowed.
Market Analysis
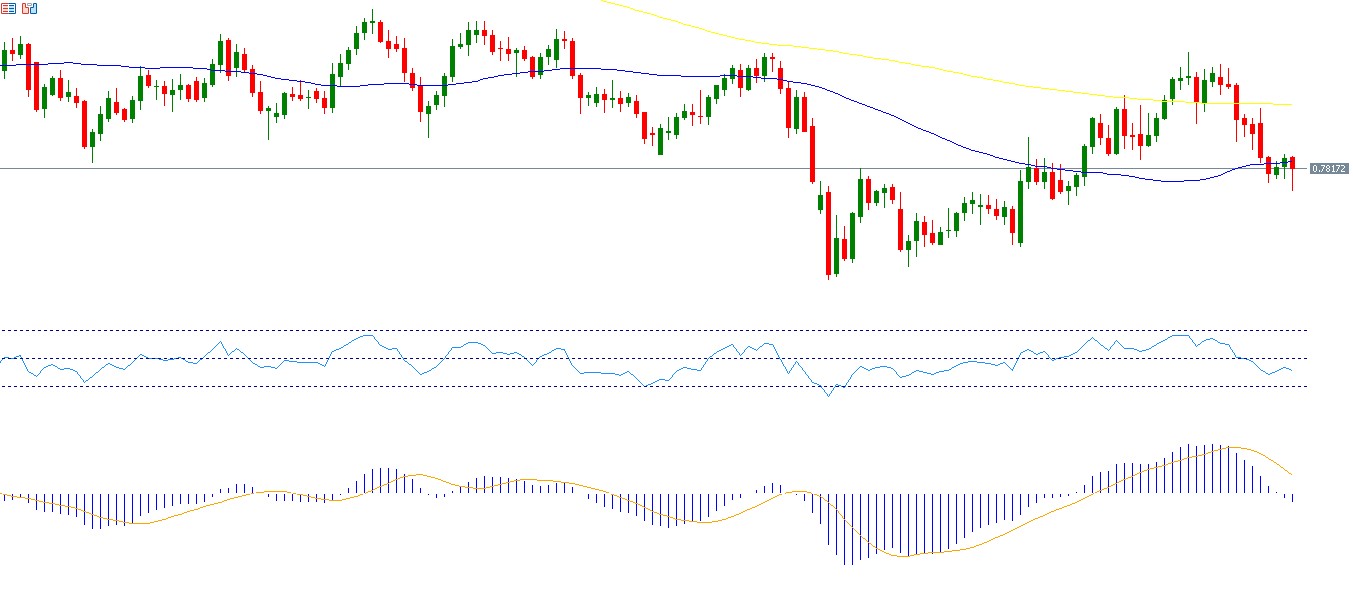
USD/CHF
The US dollar weakened against the Swiss franc, falling to 0.7775 on Friday, its lowest level since March 11, 2026, and down about 1.50% since the beginning of the year, before closing at 0.7814. The Swiss franc’s outperformance against the US dollar is largely attributed to its traditional safe-haven status during periods of uncertainty, particularly amid geopolitical tensions in the Middle East. This comes as negotiations between the United States and Iran continue, with growing optimism about reaching an agreement before the current truce expires. Recent Swiss economic data also indicates resilience in the economy. In contrast, the US dollar has been under selling pressure against most major currencies, with the US Dollar Index falling to 97.63 on Friday, its lowest level since February 27, 2026, before closing at 98.23. The Relative Strength Index (RSI) currently stands around 41, indicating negative momentum for the USD/CHF pair. Additionally, a bearish crossover between the MACD line and the signal line suggests that the negative momentum may continue.
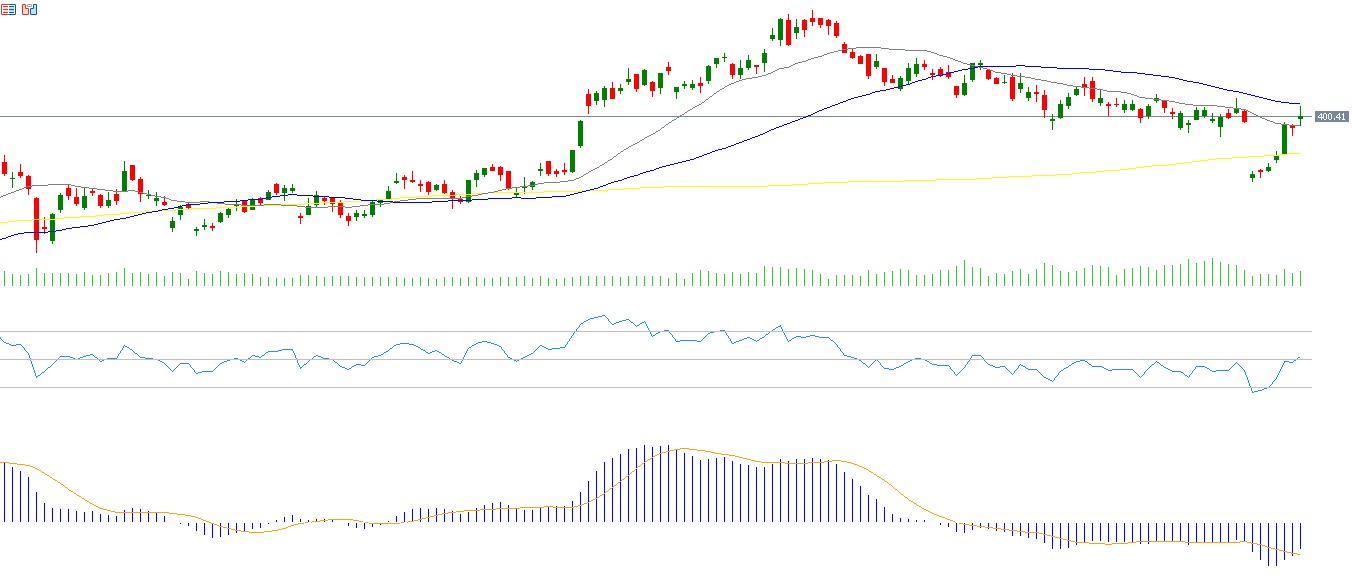
Tesla
Tesla’s stock has declined by about 11% since the beginning of the year. Markets are awaiting the company’s earnings release on Wednesday, April 22, 2026. Expectations indicate earnings of $0.41 per share, compared to $0.27 per share in the previous reading. Revenue is expected to reach $22.99 billion, up from $19.18 billion previously. The Relative Strength Index (RSI) currently stands at 60, indicating positive momentum for Tesla’s stock. In addition, a bullish crossover between the MACD line and the signal line reinforces the possibility of continued positive momentum.
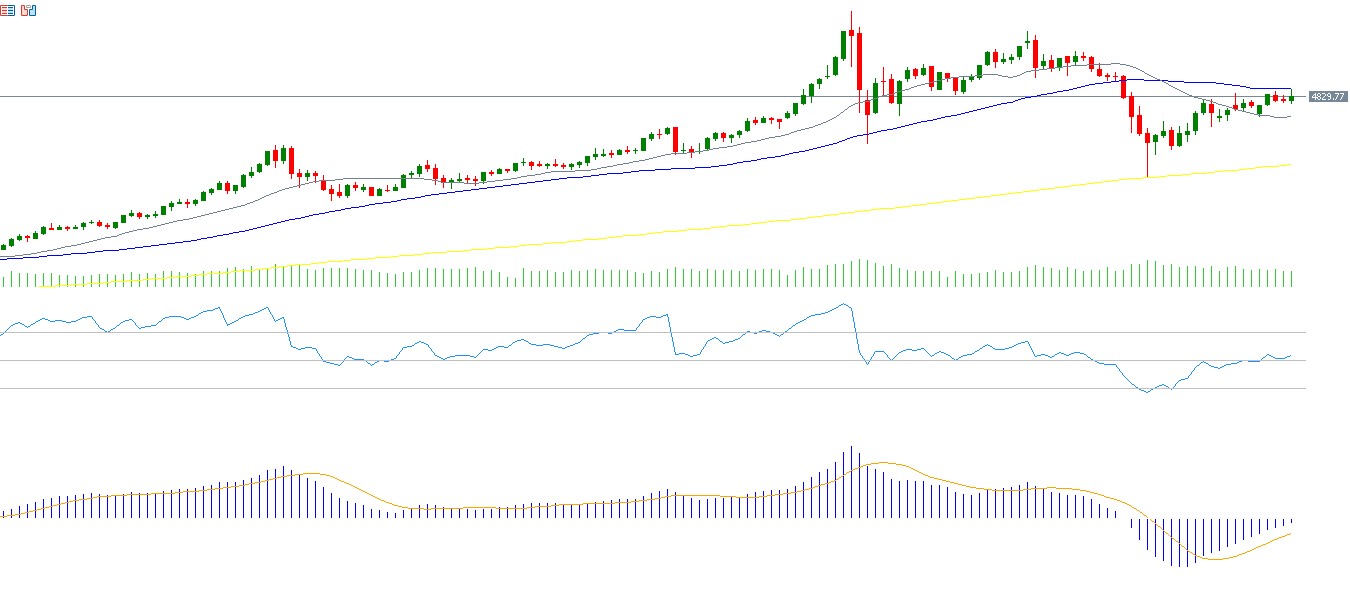
Gold
Gold prices rose by about 1.68% last week, marking the fourth consecutive weekly gain and closing at $4,829. Prices have also increased by around 12% since the beginning of the year, outperforming US equity and bond indices, Bitcoin, and the US Dollar Index. This rise is mainly attributed to easing geopolitical tensions, as negotiations between the United States and Iran continue and optimism grows regarding the possibility of reaching an agreement before the truce expires.
Gold is traditionally considered a safe-haven asset during periods of uncertainty, conflict, and geopolitical instability. However, gold has not fully played its safe-haven role during this conflict. The main reason lies in rising energy prices, particularly oil and gas, which increase inflationary risks and influence the monetary policy outlook of central banks, especially the US Federal Reserve. Markets expect interest rates to remain higher for longer, or even rise again, which supports the US dollar and weighs negatively on gold, since it does not generate yield.
Recent US inflation data for March showed headline inflation at 3.3% and core inflation at 2.6%, both still above the Federal Reserve’s 2% target. If energy prices continue to rise, inflationary pressures may intensify in the coming period, which could weigh on gold prices.
Gold may face some short-term pressure due to demand for dollar liquidity. However, positive momentum could re-emerge over the medium and long term as central banks continue to accumulate gold reserves, particularly the People’s Bank of China, which has been purchasing gold for the seventeenth consecutive month. Ultimately, gold remains a hedge against inflation, a store of value, and a source of confidence, unlike fiat currencies that tend to lose value amid rising global debt and slowing global economic growth, particularly in advanced economies. The Relative Strength Index (RSI) currently stands at 54, indicating positive momentum for gold. A bullish crossover between the MACD line and the signal line also supports the likelihood of continued positive momentum.
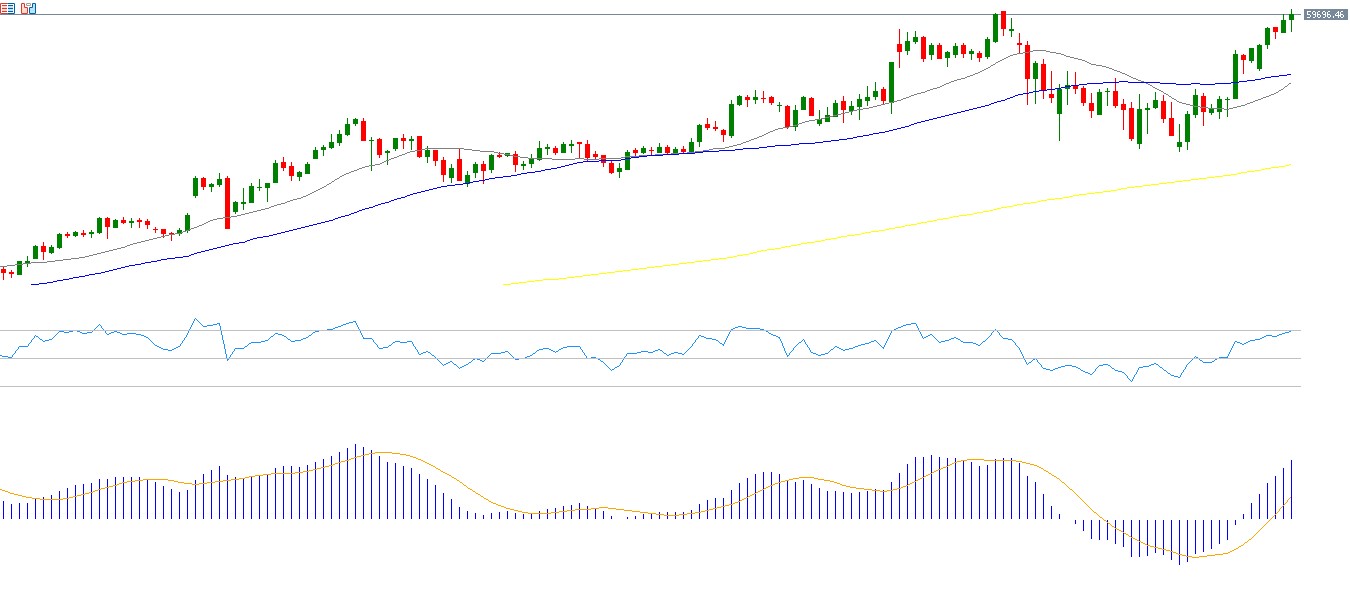
Nikkei 225 Index
The Nikkei 225 index continues its upward trajectory, reaching a new all-time high of 59,688 points on Thursday. The index has risen by about 16% since the beginning of the year, outperforming US, European, and Chinese equity indices, although it still lags behind South Korea’s Kospi index, which has gained about 47% since the start of the year.
This strong rally in Japanese equities is driven by several factors. One of the most important is the easing of geopolitical tensions in the Middle East. Japan is one of the largest importers of crude oil, and therefore any optimism regarding a truce or resolution related to the Strait of Hormuz tends to support the Japanese economy, especially when oil prices decline. The rally is also supported by Japanese Prime Minister Sanae Takaichi, whose expansionary fiscal policies encourage higher government spending, easier borrowing conditions, and tax reductions, particularly on food products, in an effort to stimulate the stagnant economy. Japanese markets have also seen strong foreign investment inflows into equities this week. In addition, the weakness of the Japanese yen has supported the market, as it recently exceeded 160 yen per US dollar, the highest level since July 2024, encouraging foreign investors to allocate more capital to Japanese equities. The Relative Strength Index (RSI) currently stands at 62, indicating bullish momentum for the index. A bullish crossover between the MACD line and the signal line further strengthens the likelihood of continued positive momentum.
Key Events This Week
Markets are closely watching several important economic indicators and data releases this week.
On Monday, markets await the People’s Bank of China lending rate and Canada’s Consumer Price Index.
On Tuesday, attention will turn to New Zealand’s Consumer Price Index, Japan’s exports and imports, the United Kingdom’s unemployment rate and wage growth including bonuses, as well as US retail sales and pending home sales.
On Wednesday, markets will focus on the UK Consumer Price Index and US crude oil inventories.
On Thursday, markets will monitor manufacturing and services PMI figures for Australia, Japan, the Eurozone, and the United States, in addition to US initial jobless claims and Canada’s Producer Price Index.
Finally, on Friday, Japan will release the national Consumer Price Index, while retail sales data will be released in the United Kingdom and Canada, alongside the University of Michigan Consumer Sentiment Index in the United States.
Please note that this analysis is provided for informational purposes only and should not be considered as investment advice. All trading involves risk.


