
Despite the recent slowdown in Switzerland’s economic indicators—such as the Consumer Price Index (CPI) and Producer Price Index (PPI), as well as a contraction in the Purchasing Managers’ Index (PMI), which fell to 48.9 points (below expectations of 50.4), and a rise in the unemployment rate to 2.8% (above both expectations and the previous reading of 2.7%)—the USD/CHF currency pair has seen a notable decline.
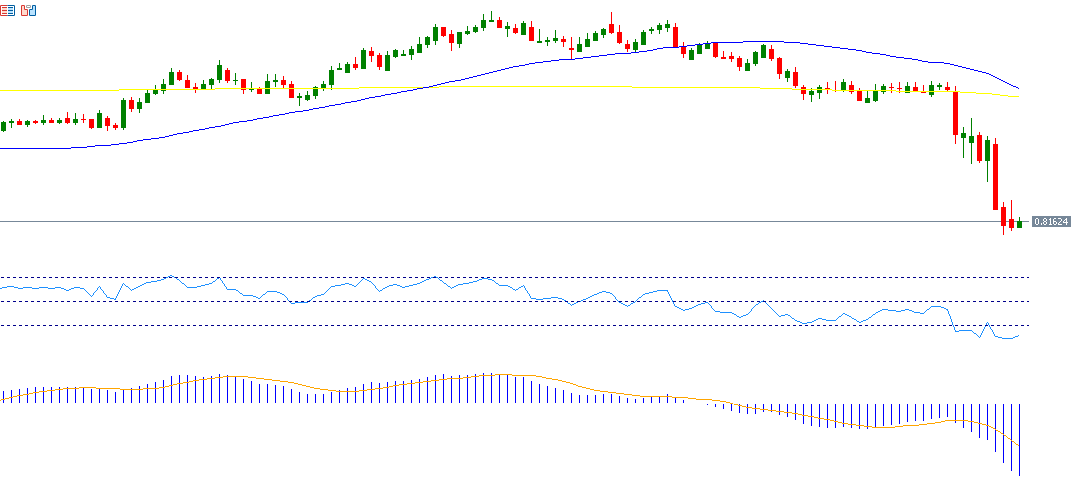
The pair reached 0.8092 on Friday, April 11, 2025, its lowest level in 14 years, and is currently trading around 0.8150. Since the beginning of the year, the U.S. dollar has fallen approximately 9% against the Swiss franc.
The franc’s strength can be attributed to its historical status as a safe-haven currency during times of global uncertainty—particularly amid the ongoing trade war between the United States and China and the associated ambiguity surrounding this conflict. Additionally, growing expectations that the U.S. economy may enter a recession have added bearish pressure on the U.S. dollar index, which is now at its lowest levels in three years.
Technical Factors:
- MACD Indicator: The blue line is below the orange signal line, indicating continued negative momentum for the USD/CHF pair.
• Directional Movement Index (DMI): The +DMI is around 5 points, while the -DMI is around 35 points, reflecting strong selling pressure on the dollar versus the franc. The ADX stands at about 47 points, signaling strong downward momentum.
• Relative Strength Index (RSI): Currently at 21 points, which places it in oversold territory, suggesting continued negative momentum.
Support and Resistance Levels:
- Support Levels: If the pivot point at 0.8184 is broken, the pair may target the levels of 0.8098, 0.8033, and 0.7947.
•Resistance Levels: If the price surpasses the pivot point, it may potentially target the levels of 0.8184, 0.8249, and 0.8400.
Please note that this analysis is provided for informational purposes only and should not be considered as investment advice. All trading involves risk.