
Gold prices reached an all-time high of $3,500 on Tuesday, April 22, 2025, before pulling back to $3,200 on Thursday, May 1, 2025—a drop of $300, or roughly 9%. This decline is likely due to a market correction and profit-taking by investors, coupled with news of easing trade tensions between the United States and several countries, as markets await upcoming negotiations between Washington and Beijing.
Gold has since rebounded, hovering around the $3,400 level.
Since the beginning of the year, gold prices have surged approximately 30%, outperforming higher-risk assets such as:
- Bitcoin
- S&P 500 Index
- Nasdaq 100 Index
This performance reflects growing investor concerns, pushing them toward the traditional safe haven—gold.
Key Fundamental Drivers Supporting Gold’s Rally:
- Geopolitical Tensions in the Middle East
- Trade Tensions: Despite talk of upcoming trade negotiations, uncertainty remains elevated, increasing demand for safe-haven assets.
- Interest Rate Expectations: Markets anticipate the U.S. Federal Reserve will cut interest rates three or four times this year, making non-yielding assets like gold more attractive.
- Weaker U.S. Dollar: The dollar index fell to 97.92 on April 21, 2025—its lowest level in three years—and is now trading near the 100 level.
- Recession Fears: The U.S. economy contracted by 0.3% in the most recent quarter, worse than both the forecast and the previous reading, raising concerns of an economic slowdown.
- Central Bank Demand: Global central banks, particularly the People’s Bank of China, continue to increase their gold reserves, supporting demand.
- Persistent Inflation: While inflation has slowed, it remains above the Fed’s 2% target, reinforcing gold’s role as an inflation hedge.
- Gold Scarcity: Estimates suggest there are 7.2 billion ounces of gold above ground and an additional 2 billion ounces still underground, enhancing gold’s value as a finite resource.
Markets are eagerly awaiting today’s interest rate decision from the U.S. Federal Reserve, with expectations that rates will be held steady within the current range of 4.25% to 4.50%. Attention is focused on Fed Chair Jerome Powell’s speech and tone, as it may offer clues regarding the future path of interest rates.
Technical Outlook:
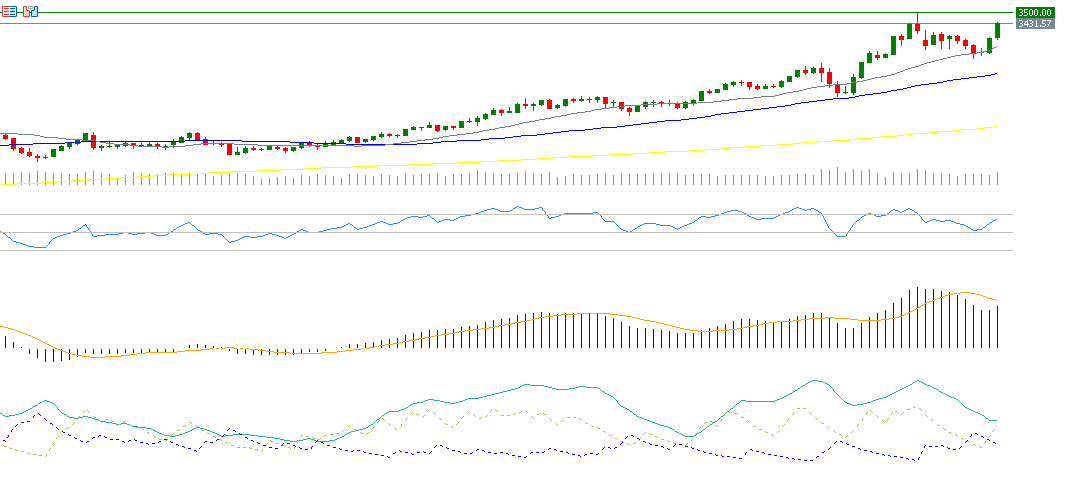
- Moving Averages: The 20-day moving average is above the 50-day, which in turn is above the 200-day—indicating a strong upward trend.
- RSI (Relative Strength Index): Currently at 63, suggesting continued bullish momentum.
- DMI (Directional Movement Index): The +DMI stands at 31, while the -DMI is at 18. The wide gap indicates strong buying pressure.
- ADX (Average Directional Index): At 32, signaling a strong uptrend.
There is key support at the 20-day moving average near $3,277. If this level is broken, prices could drop toward $3,105, the 50-day moving average. On the upside, the major challenge remains retesting and breaking above the $3,500 level.
Please note that this analysis is provided for informational purposes only and should not be considered as investment advice. All trading involves risk.