
Key Points
- US CPI for September is released on Wednesday 14 October at 12:30 UTC, with consensus at 3.6% year on year for headline and 2.5% for core, up from 3.4% and 2.4% in August. Headline is expected to jump on energy prices, while core is forecast to cool to 0.2% on the month.
- Gold is trading at 4,193.85 inside the 4,165 to 4,225 supply zone after bouncing from its 7 October low near 4,065, while the US 10-year yield has eased to 5.196% from a high near 5.36%, still far above where it started September.
- A hot core print would strengthen the case for more Fed tightening, lifting the dollar and yields and pressuring gold back toward the 4,125 demand zone. A soft print would ease that pressure and give gold room to clear 4,225 toward the 4,270 to 4,315 supply zone.
What Is the US CPI Report?
The Consumer Price Index, or CPI, is the most closely watched inflation gauge in the US. Published monthly by the Bureau of Labor Statistics, it tracks the change in prices paid by urban consumers for a fixed basket of goods and services, including food, energy, shelter, transport and medical care. September’s report lands at 12:30 UTC, or 8:30 am in New York, on Wednesday 14 October.
Two versions matter. Headline CPI covers the whole basket. Core CPI strips out food and energy, which are volatile, and is the better guide to underlying price pressure. The Federal Reserve watches the monthly core change, and within it services and shelter, most closely. With the next Fed decision on 28 October and money markets pricing roughly an 81% chance of a December hike, this report helps decide how much more tightening the market expects.
Markets trade the surprise relative to consensus, not the headline figure. A reading hotter than forecast strengthens the case for further hikes, which typically lifts the dollar and yields and weighs on gold. A cooler reading tends to do the opposite.
What to Expect on Wednesday
| Release | Forecast | Previous | Time (UTC) |
| Headline CPI y/y | 3.6% | 3.4% | 12:30 |
| Headline CPI m/m | 0.6% | 0.4% | 12:30 |
| Core CPI y/y | 2.5% | 2.4% | 12:30 |
| Core CPI m/m | 0.2% | 0.3% | 12:30 |
Estimates for headline CPI year on year cluster between 3.5% and 3.8%, with the Cleveland Fed nowcast near 3.6%. The jump is energy-led: higher gasoline and motor fuel prices are expected to lift the monthly headline reading, and the energy index was already up 16.3% year on year in August. That makes oil, which has traded around $92 to $94 this week on Middle East supply risks, part of the inflation story as well as the geopolitical one.
Core is the number that matters most for the Fed. It is forecast at 0.2% month on month, down from 0.3% in August, partly because August’s wireless telephone spike should reverse, though shelter and medical care may firm. August’s 0.3% core print came in above the 0.2% forecast and pushed hike odds sharply higher at the time, a reminder of how sensitive the market is to core upside. Money markets currently price roughly a one in four chance of an October hike.
US 10-Year Yield: Easing From the Highs, Still Elevated
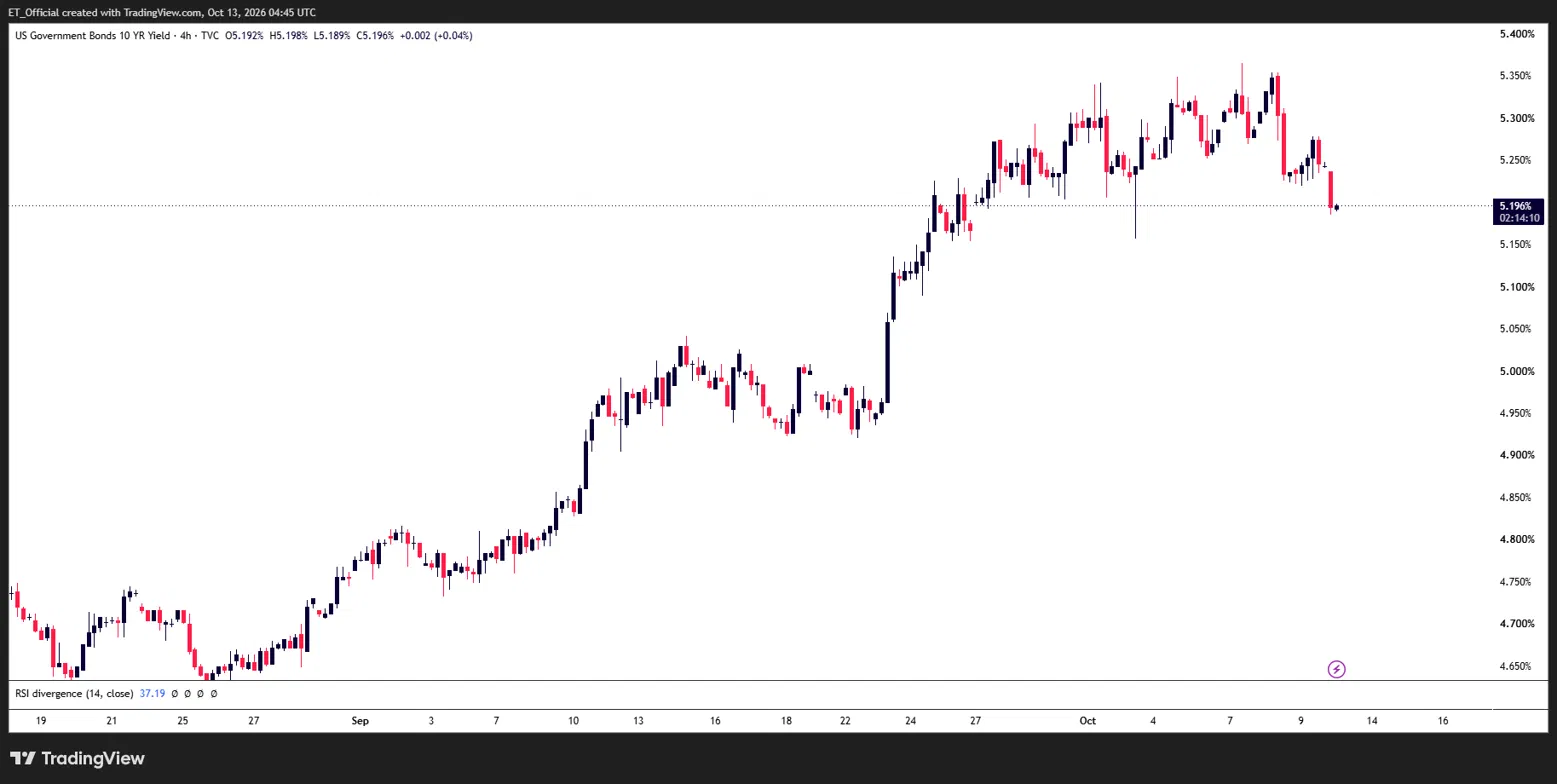
Chart: US 10-Year Treasury Yield, 4H timeframe (TradingView)
US 10-Year Treasury yield (US10Y) 4H chart, 19 August to 13 October 2026: yield rose from a low near 4.64% in late August to a high near 5.36% on 7 October, and has since pulled back to 5.196%.
The bond market has been central to the dollar and gold story. The 10-year yield climbed from a low near 4.64% in late August to a high near 5.36% on 7 October, breaking above 5.0% in the final week of September along the way. Since that high it has pulled back, slipping to 5.196% on Tuesday morning ahead of the inflation data. Even after the dip, yields remain well above where September began.
This matters for gold because gold pays no income. When yields rise, holding it costs more in forgone return, and when yields fall that cost shrinks. The same logic runs through the dollar, where higher US yields tend to attract capital. CPI is the next test of whether the pullback extends or yields turn back toward the October high: a hot print would push rate hike expectations, and yields, higher, while a soft print would likely deepen the retreat.
Gold: Testing Supply Ahead of CPI
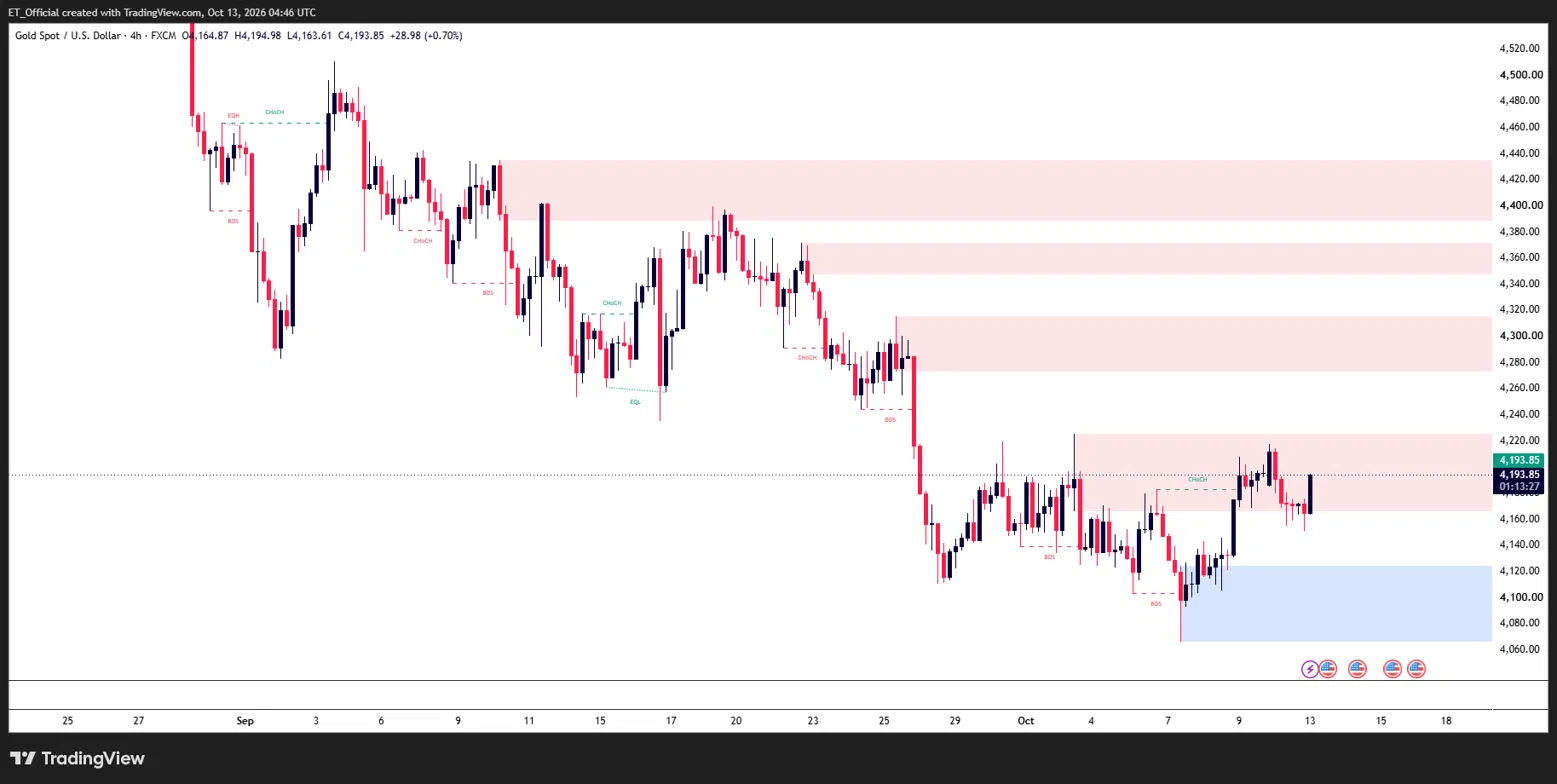
Chart: XAU/USD, 4H timeframe (TradingView, SMC)
Gold (XAU/USD) 4H chart, 25 August to 13 October 2026: price fell from a high near 4,510 in early September to a low near 4,065 on 7 October, and has rebounded to 4,193.85, trading inside the 4,165 to 4,225 supply zone.
Gold has been in a corrective structure since the early September high near 4,510, with rallies repeatedly failing at supply and a sharp break lower in late September. The 7 October low near 4,065 produced a bounce through a change of character near 4,180, and price now sits at 4,193.85, up 0.7% on the 4H candle, inside the 4,165 to 4,225 supply zone. The 4,225 high from 3 October is the level capping the move.
The dollar is the other half of the setup. The Dollar Index has held near 102 to 103 as markets price further Fed tightening, and gold has struggled to break higher against that backdrop. A hot CPI print that strengthens the dollar would likely send gold lower from supply, while a soft one that weakens the dollar would give buyers the chance to push through 4,225. The 4,125 to 4,065 demand zone is the floor below, and above 4,225 the next supply sits at 4,270 to 4,315.
Three Scenarios for Wednesday
Soft CPI (core 0.1% or less month on month, or headline 3.5% or less year on year)
A cooler print, especially a soft core reading, would ease the pressure on the Fed to keep tightening and would likely lower hike odds, yields and the dollar. That is the backdrop gold needs to clear the 4,225 high and open a path toward the 4,270 to 4,315 supply zone.
In line CPI (headline near 3.6%, core near 0.2% month on month)
A print close to consensus leaves the Fed’s path broadly unchanged, with a December hike largely priced. Gold likely stays inside the 4,125 to 4,225 range, and the initial reaction may fade as attention shifts to the details, particularly shelter and services, and to the Fed’s 28 October meeting.
Hot CPI (core 0.3% or more month on month, or headline 3.8% or more year on year)
A hot print, especially a core reading of 0.3% for a second month running, would reinforce the case for further hikes and raise October odds as well as December. Yields would likely push back toward the 5.36% high and the dollar would strengthen. Gold would be vulnerable to rejection from the 4,165 to 4,225 supply zone, with the 4,125 demand zone in play and the 4,065 low back in view if the move extends.
Risk Warning: Trading financial instruments, particularly those involving leverage, involves a substantial degree of risk and is not appropriate for all investors. The value of your investments can rise or fall sharply, and it is possible to lose the entirety of your invested capital. Do not trade with funds you cannot afford to lose. Nothing in this site should be read or construed as constituting advice on the part of Taurex or any of its affiliates, directors, officers or employees.