
Key Points
- The 10 year Treasury yield has pushed above 5% for the first time since 2007, and that single move is doing most of the damage across today’s board, pressuring gold, weighing on tech heavy indices, and keeping the dollar side of EUR/USD bid.
- EUR/USD is trading at 1.1539, having broken down through the 1.1580 zone that had capped it for most of the week, with a retracement back into that broken support now the cleanest short setup on the board.
- US100 is trading at 29,048, sitting right at the base of this week’s weekend gap after being rejected twice from the 29,400 to 29,480 zone, with AI capex jitters compounding the pressure from rising yields.
- Gold is trading at 4,291, extending its slide as the 5% yield level raises the opportunity cost of holding a non yielding asset, with the broken 4,310 to 4,330 zone now the level to watch for a short entry.
Trade 1: EUR/USD Short from Supply
| Pair | Direction | Entry Zone | Target 1 | Target 2 | Invalidation |
| EURUSD | Short | 1.1570 to 1.1590 | 1.1500 | 1.1460 | Above 1.1620 |
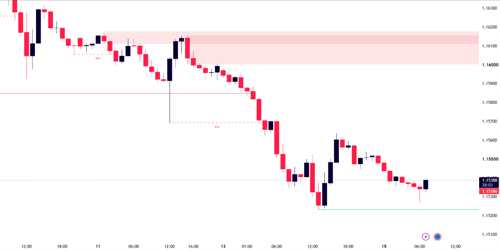
Chart: EUR/USD, H1 timeframe (TradingView, SMC)
The H1 chart shows EUR/USD rejecting the 1.1600 to 1.1620 zone twice this week before a break of structure finally cracked the 1.1580 support beneath it. That level held for days and its failure marks a genuine shift, with price extending the decline to a low near 1.1530 and now consolidating at 1.1539.
The trade looks for a retracement back into the 1.1570 to 1.1590 zone, the broken support that should now act as fresh resistance, for a short continuation in line with the break of structure. This is a classic supply retest rather than chasing the move, giving a cleaner risk to reward profile than shorting into weakness directly.
The fundamental backdrop supports the technical picture for now. The 10 year Treasury yield pushing above 5% for the first time since 2007 is keeping the dollar side of the pair firm, and tomorrow’s Fed decision, where a 25 basis point hike is close to fully priced, gives little reason for that support to fade before Wednesday.
Trade 2: US100 Short from Supply
| Pair | Direction | Entry Zone | Target 1 | Target 2 | Invalidation |
| US100 | Short | 29,150 to 29,250 | 28,900 | 28,750 | Above 29,400 |
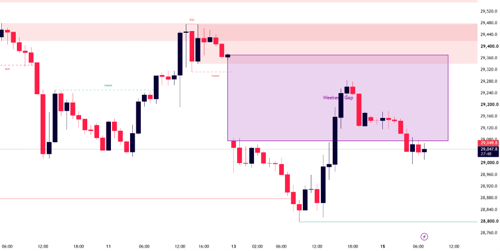
Chart: US100 (Nasdaq 100), H1 timeframe (TradingView, SMC)
The H1 chart shows US100 rejected twice from the 29,400 to 29,480 zone this week, each time triggering a change of character and a fresh break of structure lower. Price has now round tripped this week’s weekend gap and is sitting right at its base near 29,048, close to the 28,800 level that marked the prior strong low.
The trade looks for a shallow retracement into the 29,150 to 29,250 zone, inside the lower half of the weekend gap, for a short continuation toward that prior strong low and beyond. A clean break and hold below 28,800 would open room toward a deeper move.
Rising Treasury yields above 5% and renewed AI capex jitters are the twin fundamental pressures behind this setup, both weighing most heavily on the tech heavy Nasdaq complex. Oil holding above $100 on the back of ongoing Hormuz related supply concerns adds a further layer of risk off pressure into the session.
Trade 3: Gold Short from Supply
| Pair | Direction | Entry Zone | Target 1 | Target 2 | Invalidation |
| XAUUSD | Short | 4,310 to 4,330 | 4,250 | 4,200 | Above 4,400 |
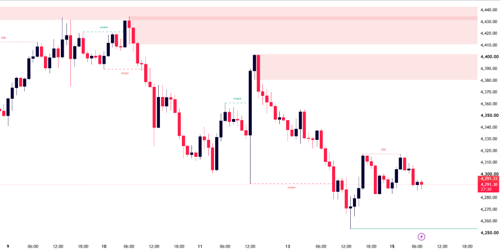
Chart: XAU/USD, H1 timeframe (TradingView, SMC)
Gold’s H1 chart shows a similar story to the other two boards. A change of character off the highs near 4,410 to 4,440 triggered a heavy break of structure lower, and a sharp recovery attempt into the 4,380 to 4,400 zone was rejected cleanly, confirming that level as fresh supply. Price has since extended the decline to its current level of 4,291.
The trade looks for a retracement into the 4,310 to 4,330 zone, the most recent area where price consolidated before the latest leg down, for a short continuation in line with the broader bearish structure.
The fundamental backdrop is straightforward for once. The 10 year Treasury yield breaking above 5% for the first time since 2007 raises the opportunity cost of holding a non yielding asset like gold, and with tomorrow’s Fed decision expected to deliver a hike that is already close to fully priced, there is little on the calendar between now and then to reverse that pressure.
Key Events This Week
Wednesday 16 September: UK CPI (07:00 UTC), US Retail Sales (12:30 UTC), and the Fed’s rate decision (18:00 UTC), where a 25 basis point hike is close to fully priced
Thursday 17 September: Bank of England rate decision, widely expected to hold at 3.75%
Friday 18 September: Bank of Japan decision (tentative), with markets weighing whether the policy rate moves above 1.00% for the first time this cycle
Risk Warning: Trading financial instruments, particularly those involving leverage, involves a substantial degree of risk and is not appropriate for all investors. The value of your investments can rise or fall sharply, and it is possible to lose the entirety of your invested capital. Leveraged products, in particular, amplify both potential gains and losses. Before engaging in such trading, you must assess your financial goals, experience level, and appetite for risk. It is your sole responsibility to ensure that you understand the mechanics and risks of trading, including margin requirements, and to seek independent financial advice where appropriate. Do not trade with funds you cannot afford to lose. Nothing in this site should be read or construed as constituting advice on the part of Taurex or any of its affiliates, directors, officers or employees.