Key Points
- Kevin Warsh’s first FOMC meeting delivered a hawkish surprise last week. The dot plot shifted the median year end rate forecast to 3.8%, up from 3.4% in March, with 9 of 19 officials now expecting at least one rate hike this year. The dollar surged to a one year high and gold crashed from $4,380 to $4,120 before bouncing.
- Thursday’s Core PCE data is the most important release this week. This is the Fed’s preferred inflation gauge and will either validate the hawkish dot plot shift or give markets room to breathe. The Q1 GDP final estimate (forecast 1.6%) and Australian employment data also land on Thursday.
- Both gold and Ethereum are bouncing today after last week’s selloff. The H1 charts show Change of Character (CHoCH) signals on both assets, suggesting the selling pressure may be exhausting. But major supply zones overhead at $4,320 to $4,380 on gold and $1,780 to $1,820 on ETH need to be cleared before any bullish conviction.
- UK Prime Minister Keir Starmer announced his resignation today after Labour lost over 1,000 council seats in May’s local elections. The pound dropped 0.3% to $1.319 on the news. With Andy Burnham expected to succeed him and Tuesday’s UK flash PMIs on deck, GBP faces an uncertain week as traders weigh the fiscal policy outlook under new leadership.
The Macro Picture
Last week was defined by a single event: Kevin Warsh’s first FOMC meeting as Federal Reserve Chair. The committee voted unanimously (12 to 0) to hold rates at 3.50% to 3.75%, which was widely expected. But the updated dot plot was the shock. The median year end rate forecast jumped to 3.8%, up from 3.4% in March, meaning policymakers now expect rates to end the year higher than where they sit today. Nine of the 19 officials projected at least one rate hike before December.
Warsh used the press conference to drop a bombshell of his own: he eliminated the traditional forward guidance language entirely, saying the Fed would be “data dependent on a meeting by meeting basis” and announced task forces to overhaul major Fed operations. That is a meaningful shift in communication style. Under Powell, markets had guidance to anchor expectations. Under Warsh, there is no anchor.
The market reaction was immediate. The US Dollar Index surged to a one year high. The 2 year Treasury yield jumped 16 basis points to 4.216%. Gold, which had been rallying into the decision and touched $4,380 intraday, reversed sharply and fell to $4,120 before finding a floor. Ethereum mirrored the move, spiking to $1,860 on ceasefire optimism before the FOMC decision dragged it to $1,660. Both assets are bouncing today, but the damage from the dot plot shift is real.
On the geopolitical front, the US and Iran ceasefire agreement from June 14 continues to hold in name, but the situation remains fragile. Iran has disputed whether the Strait of Hormuz is fully open, and Israeli strikes on Hezbollah in Lebanon threaten to unravel the deal. Traders are treating the ceasefire with scepticism after the April agreement collapsed on similar complications.
Closer to home for GBP traders, UK Prime Minister Keir Starmer announced his resignation today. The move comes after Labour lost more than 1,000 council seats in May’s local elections, and dozens of Labour MPs wrote to Starmer asking him to step down. The pound dropped 0.3% to $1.319 on the news, though gilts held relatively steady with the 10 year yield ticking marginally higher to 4.85%. Andy Burnham, the former Mayor of Greater Manchester who returned to Parliament last week, is widely expected to succeed Starmer as Labour leader and Prime Minister. The market reaction has been muted so far because Burnham is seen as a continuity candidate rather than a radical shift in policy direction. But traders should watch for any signals around fiscal policy under the new leadership, particularly given the UK’s already stretched debt position. Sterling has already lost around 3% since February as the political uncertainty built, and Tuesday’s UK flash PMIs will be the first hard data test for GBP this week. A weak reading on top of the leadership transition could push cable toward the $1.30 handle.
Gold: The Post-FOMC Recovery
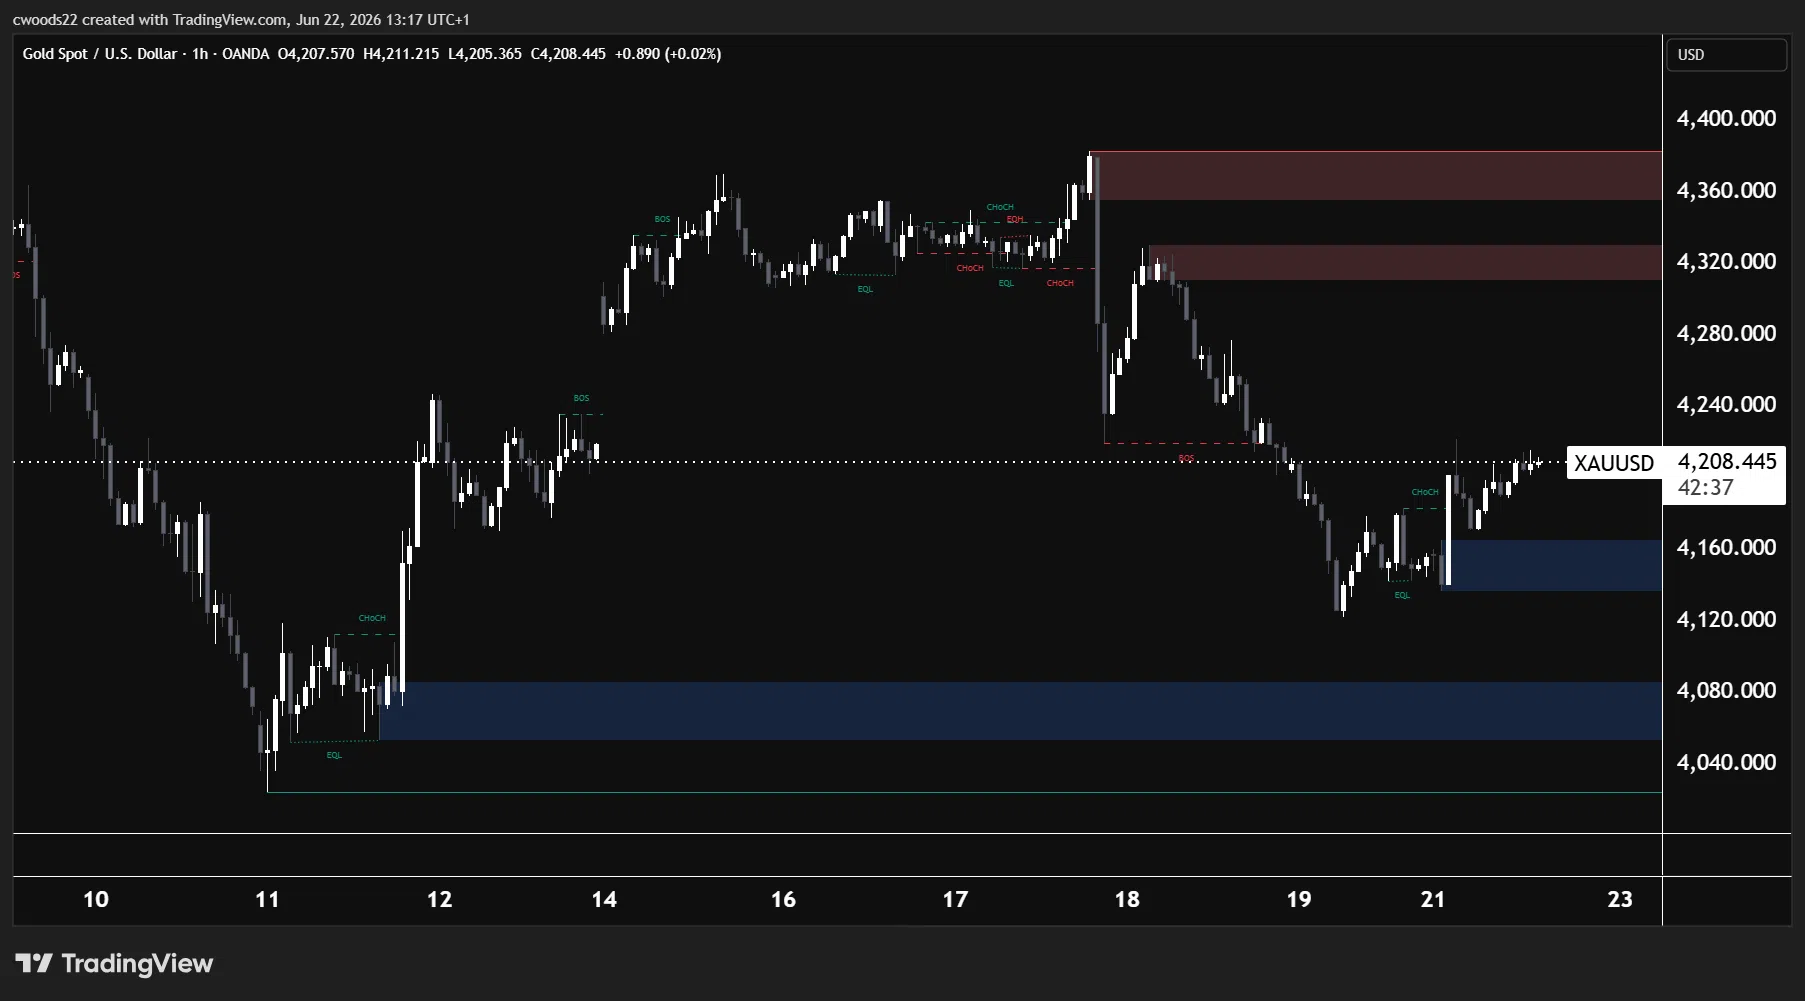
Chart: XAU/USD, H1 timeframe (TradingView, SMC)
Gold at $4,208 is in recovery mode after last week’s FOMC driven selloff, and the H1 chart shows an interesting structural shift developing. Price crashed from the $4,380 intraday high (where it was trading just before the FOMC decision) all the way to $4,120, sweeping the equal lows (EQL) at that level before bouncing. The selloff was clean and impulsive, with multiple Break of Structure (BOS) confirmations on the way down.
What makes the current bounce notable is the Change of Character (CHoCH) signal that has formed around the $4,200 level. A CHoCH occurs when price breaks a key swing high during a downtrend, signalling that the selling pressure may be shifting. This is the first bullish structural signal on the H1 since the FOMC selloff, and it suggests the immediate downside momentum has stalled.
On the demand side, the major zone sits at $4,060 to $4,090, marked by the blue zone on the chart. This level held during the June 11 selloff and remains the structural floor. There is a smaller demand zone around $4,150 to $4,170 that provided the initial reaction on the bounce. On the supply side, the $4,320 to $4,380 zone is where the FOMC rejection occurred and is now the overhead resistance that bulls need to clear. Until gold reclaims that zone, the broader structure from last week remains bearish.
Thursday’s Core PCE print is gold’s next defining moment. The previous reading came in at 0.2% month on month, and the forecast is 0.3%. If Core PCE matches or exceeds the forecast, it validates the hawkish dot plot and the dollar continues to strengthen, which would push gold back toward the $4,060 to $4,090 demand zone. A softer reading below 0.2% would be the catalyst for a deeper recovery toward the $4,320 to $4,380 supply zone. Tuesday’s flash PMIs will also influence gold through the dollar channel. If the US manufacturing PMI stays above 54 and the services reading holds above 50, it reinforces the strong economy narrative that is keeping rates elevated.
Ethereum: Testing the Supply Zone
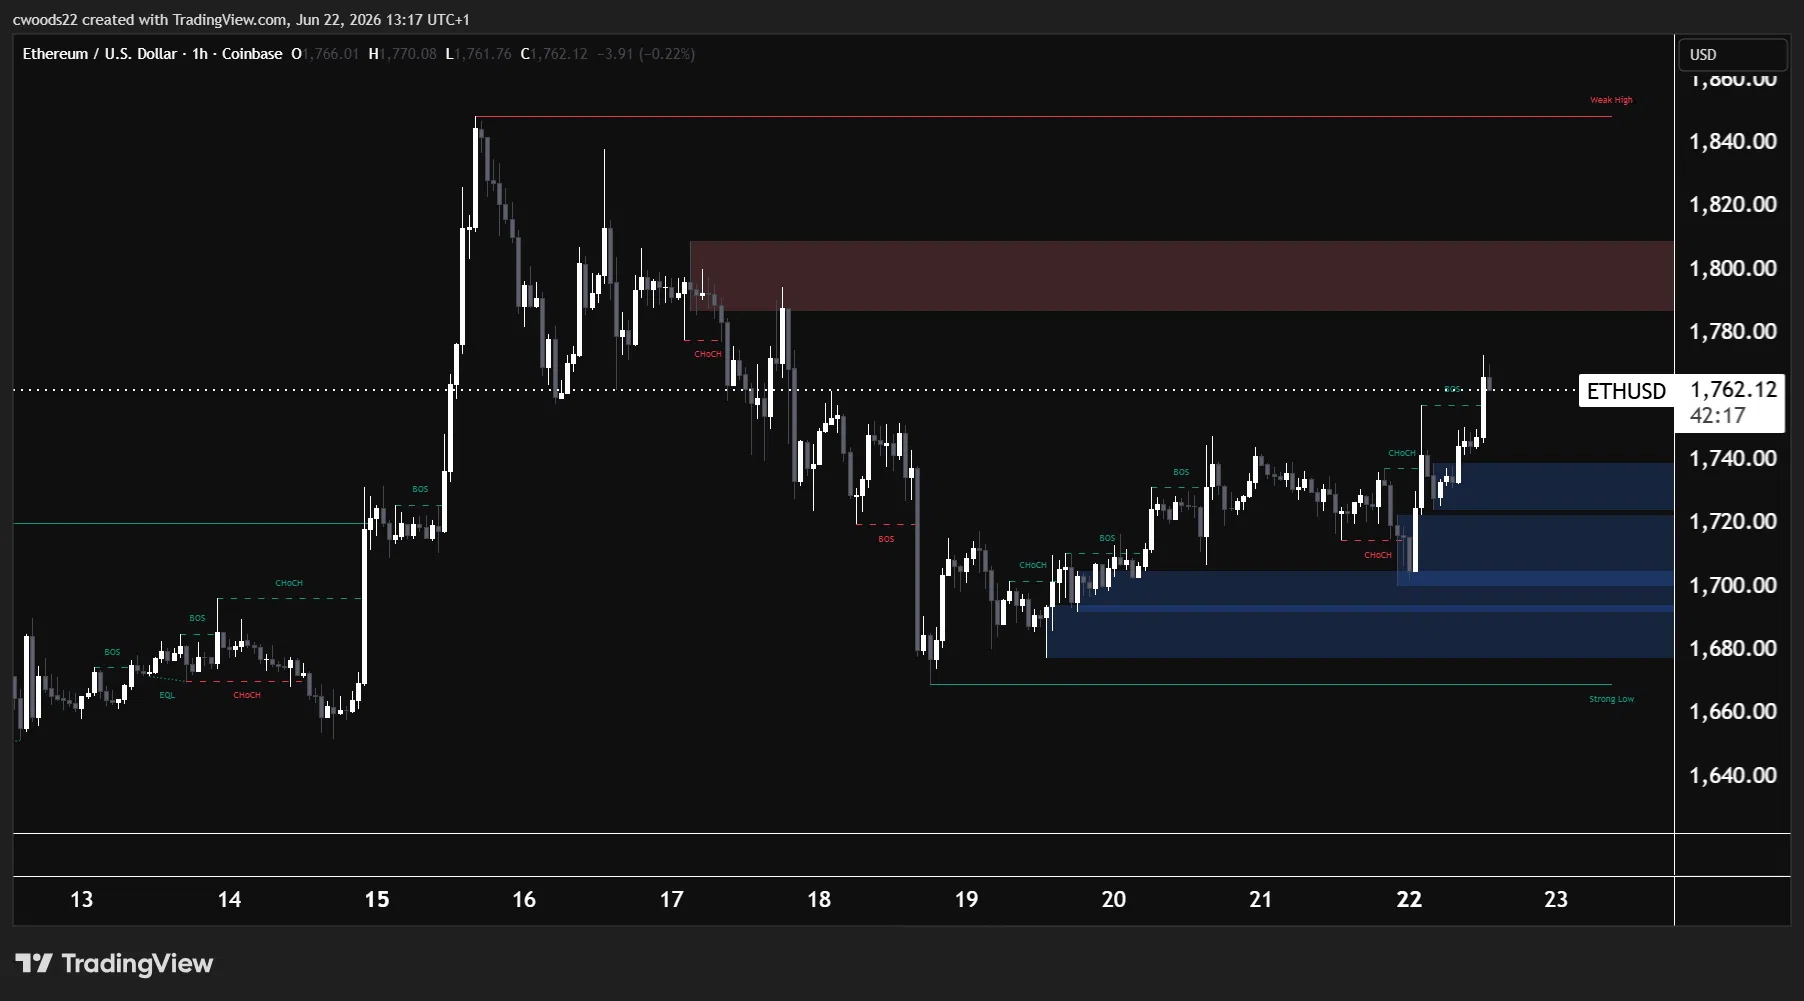
Chart: ETH/USD, H1 timeframe (TradingView, SMC)
Ethereum at $1,762 has recovered sharply from the Strong Low at $1,660 and is now approaching the first meaningful supply zone on the H1 chart. The structure of the recovery is worth examining closely because it tells us whether this is a genuine shift in momentum or just a relief bounce into resistance.
The selloff from the $1,860 Weak High (which formed on the Iran ceasefire rally around June 16 to 17) to the $1,660 Strong Low was violent and fast, driven by the FOMC’s hawkish surprise. But the recovery has been more constructive than gold’s. There are multiple BOS confirmations on the way up from $1,660, and a clear CHoCH (Change of Character) has formed around the $1,720 to $1,740 area. This shift, combined with the BOS sequence, suggests that the buyers who stepped in at the Strong Low are building a genuine base rather than just covering shorts.
The challenge sits directly overhead. The supply zone between $1,780 and $1,820 is where the January distribution phase played out, and it aligns with the area where the FOMC selloff accelerated. Price is now entering this zone at $1,762, and the reaction here will determine the next leg. A clean break and hold above $1,820 would open the path toward retesting the $1,860 Weak High. Weak Highs in Smart Money terms are levels that the market has not properly defended, meaning there is liquidity sitting above that level that price may want to sweep.
On the downside, the $1,680 to $1,720 demand zone has been clearly established. If the supply zone rejects price and ETH falls back, this is the first support area. Below that, the Strong Low at $1,660 is the line in the sand. A break below $1,660 would shift the entire structure bearish and point toward $1,600.
The broader crypto narrative is still struggling. Bitcoin ETF flows remain weak at just $536 million year to date, and the Fed’s hawkish stance under Warsh has removed the rate cut catalyst that crypto bulls were banking on. However, the ceasefire rally showed that ETH can still move sharply on positive catalysts. If the ceasefire holds and Thursday’s data comes in softer than expected, ETH could see a squeeze higher given the current positioning.
What to Watch This Week
Monday (today) brings Canadian CPI at 12:30 UTC (month on month forecast 0.7%, previous 0.4%) and two ECB President Lagarde speeches. Canada’s CPI has direct implications for the Bank of Canada’s next move, and Lagarde’s comments will be watched for any signals on the ECB’s rate path after the June cut.
Tuesday is flash PMI day across the major economies. French, German, UK, and US manufacturing and services readings drop between 07:15 and 13:45 UTC. The US manufacturing PMI is expected at 54.6 (previous 55.3) and services at 51.0 (previous 50.9). These are the first activity readings for June and will show whether the economy is maintaining the resilience that is keeping the Fed hawkish. The UK PMI readings carry extra weight this week given the Starmer resignation. Any signs of economic weakness will amplify the political uncertainty already weighing on the pound. Bank of Canada Governor Macklem also speaks at 13:25 UTC.
Wednesday brings Australian CPI at 01:30 UTC (year on year forecast 4.3%, previous 4.2%). If Australian inflation reaccelerates, it would reinforce the RBA’s hawkish stance and support the Australian dollar. This is relevant for gold because AUD strength often coincides with commodity demand.
Thursday is the heavyweight session. Australian employment data drops at 01:30 UTC (forecast 30,300 jobs added, previous negative 18,600). Then at 12:30 UTC, the US Core PCE Price Index arrives (month on month forecast 0.3%, previous 0.2%) alongside the Q1 GDP final estimate (forecast 1.6%). Core PCE is the release that matters most. It is the Fed’s preferred inflation gauge and will determine whether the hawkish dot plot shift was justified. Tokyo Core CPI rounds out Thursday at 23:30 UTC.
Friday closes with the revised University of Michigan Consumer Sentiment reading (forecast 50.0, previous 48.9) and inflation expectations (previous 4.6%). If inflation expectations stay elevated above 4%, it gives the Fed another reason to keep rates high or consider a hike, adding further pressure to both gold and crypto.