
Recent Turkish economic data shows that the Turkish economy is experiencing weakness, as:
- The GDP contracted by 0.2% on a quarterly basis, the same adjusted decline recorded in the second quarter. This is the first time since 2018 that the economy has contracted for two consecutive quarters, indicating that the economy has entered a technical recession.
- The consumer confidence index in November declined, registering 79.8 points, which is lower than the previous reading (80.6).
- Exports decreased, recording 22.30 billion Turkish lira in November, which is lower than the previous reading (23.60 billion Turkish lira).
- The consumer price index on a yearly basis in Turkey grew by 47.09% in November, exceeding expectations (46.60%) but lower than the previous reading (48.58%).
- The producer price index on a yearly basis in November recorded a growth of 29.47%, which is lower than the previous reading (32.24%).
The weak economic figures mentioned above suggest that the Central Bank of Turkey is likely to begin cutting interest rates in the upcoming period to support the economy. Interest rates have remained stable at 50% for eight consecutive months. The markets are awaiting the Central Bank’s interest rate decision on Thursday, December 26, 2024.
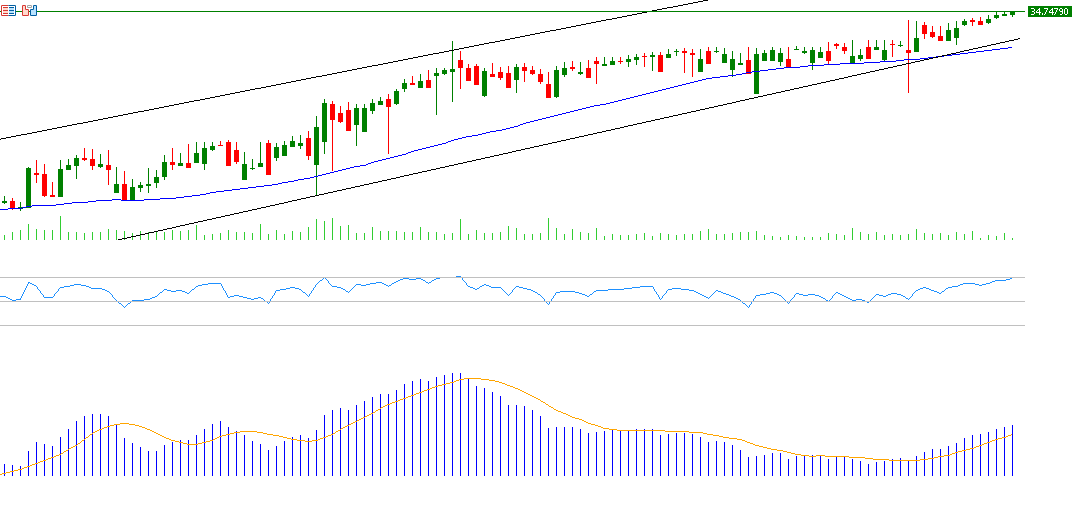
The exchange rate of the US dollar to the Turkish lira recorded 34.7479 today, the highest level ever. The price is currently hovering around 34.7400 lira per dollar. The dollar has risen against the Turkish lira by approximately 18% since the beginning of the year.
From a technical perspective, the upward trend of the USD/TRY pair seems to be dominant in the coming period, especially with the continued positive momentum for this pair, as the Relative Strength Index (RSI) registers 77 points, in the overbought zone. Additionally, the MACD indicator (in blue) has crossed above the Signal Line (in orange), signaling bullish momentum for the USD/TRY pair.
Furthermore, there is alignment in the 20, 50, and 200-day moving averages with an upward trend, where the 20-day moving average has crossed above the 50-day moving average, and the 50-day moving average has crossed above the 200-day moving average.
Please note that this analysis is provided for informational purposes only and should not be considered as investment advice. All trading involves risk.


