
Heikin Ashi Forex Trading Strategies: How to Read and Trade the Candles
Forex markets can be noisy, making it hard to see the true direction of a trend. Heikin Ashi candles were designed to smooth price action so traders can focus on the bigger picture instead of every short-term fluctuation.
A Heikin Ashi Forex trading strategy uses this smoothed data to identify trends, time entries, and stay in strong moves longer while filtering out much of the noise that produces false signals on standard charts.
This guide explains what Heikin Ashi candles are, how they are calculated, how to read the signals they generate, and how traders apply them in Forex. With an FX trading platform like Taurex, you can switch to a Heikin Ashi chart on MT4 or MT5 and apply these techniques directly to your analysis.
What Are Heikin Ashi Candles?
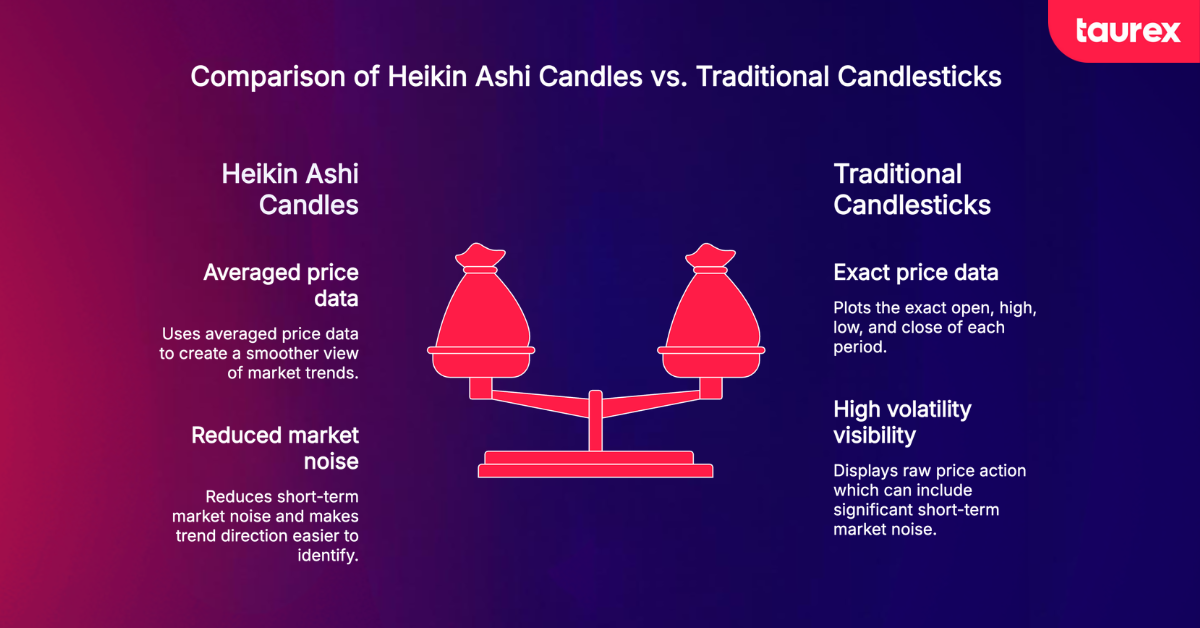
Heikin Ashi translates to “average bar” in Japanese. Unlike traditional candlesticks, which plot the exact open, high, low, and close of each period, Heikin Ashi candles use averaged price data to create a smoother view of market trends. The goal is to reduce short-term market noise and make trend direction easier to identify.
How are Heikin Ashi Candles Calculated?
The four values work like this:
- HA Close = (Open + High + Low + Close) / 4
- HA Open = (Previous HA Open + Previous HA Close) / 2
- HA High = Maximum of (High, HA Open, HA Close)
- HA Low = Minimum of (Low, HA Open, HA Close)
Because each candle incorporates information from the previous one, Heikin Ashi charts appear much smoother than standard candlestick charts. This makes it easier to identify trends and potential reversals. If you want to strengthen your understanding of regular candlestick structure first, our guide on how to read candlestick charts is a useful place to start.
How to Read Heikin Ashi Candles
Learning how to read Heikin Ashi candles starts with understanding what different formations represent, which makes it much easier to identify trend direction, momentum, and potential reversals.
Heikin Ashi Candle Structure
Like traditional candlesticks, Heikin Ashi candles have a body and upper and lower wicks. Green candles indicate bullish momentum, while red candles indicate bearish momentum.
The key difference is that each candle is calculated using both current and previous price data, creating a smoother sequence. Recognising Heikin Ashi candle patterns is straightforward once you know what to look for: a candle with no lower wick often signals a strong uptrend, while a candle with no upper wick suggests a strong downtrend. Small bodies with long wicks on both sides can indicate indecision or a potential reversal.
Bullish Heikin Ashi Signals
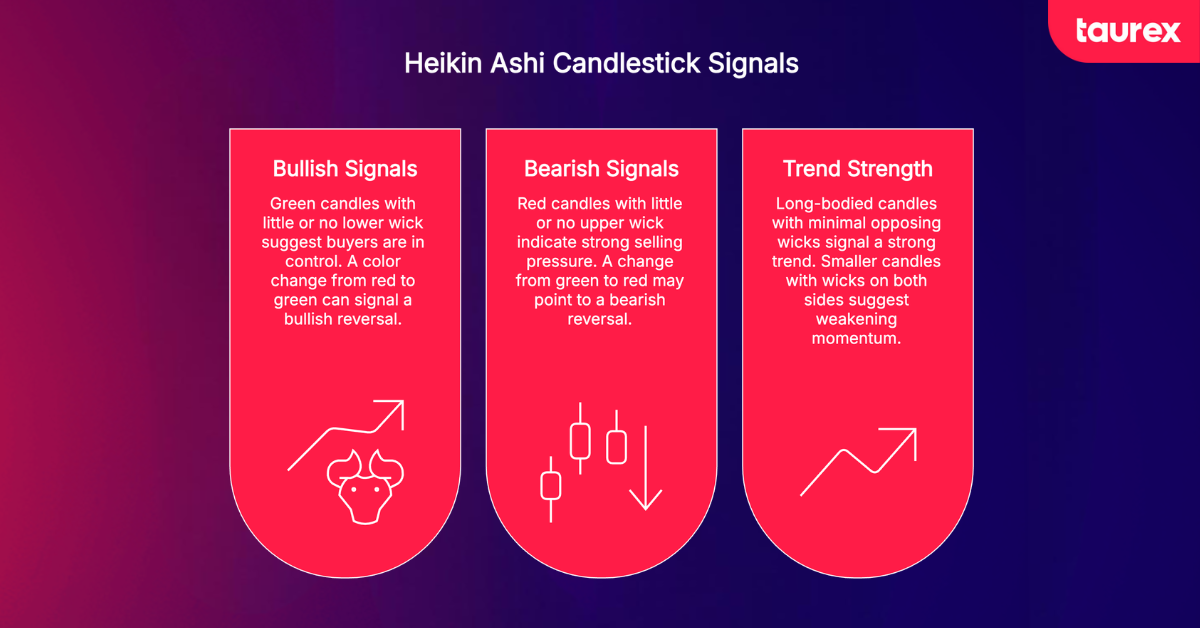
A series of green candles with little or no lower wick suggests buyers remain in control. A colour change from red to green can signal the start of a bullish reversal. Many traders wait for two or three candles in the new direction before entering, which reduces the risk of acting on a false signal.
Bearish Heikin Ashi Signals
Consecutive red candles with little or no upper wicks show sellers are firmly in control, and the longer the sequence runs, the stronger the bearish momentum tends to be. A shift from green to red can mark the beginning of a bearish reversal, particularly after an extended uptrend, but waiting for two or three consecutive red candles helps filter out temporary pullbacks before entering a short.
Reading Trend Strength And Weakness
One of the biggest advantages of Heikin Ashi is its ability to highlight trend strength. Long-bodied candles with minimal opposing wicks often signal a strong trend, while smaller candles with wicks on both sides suggest weakening momentum or consolidation.
When these indecisive candles begin to appear, it may be a sign to tighten stops, take partial profits, or wait for further confirmation before entering a new position.
Why Forex Traders Use Heikin Ashi Charts
The main advantage of Heikin Ashi charts is their ability to reduce market noise. Traditional candlestick charts display every price fluctuation, which can sometimes create false signals and make trends harder to interpret. By smoothing price action, Heikin Ashi charts make it easier to identify the underlying direction of the market.
This clearer view can help traders stay focused on the broader trend rather than reacting to every short-term move. As a result, Heikin Ashi is particularly popular among trend-following traders and is often used on major currency pairs such as EUR/USD, GBP/JPY, and USD/JPY.
For traders using Taurex, Heikin Ashi charts are available on both MT4 and MT5, making it easy to switch between chart types and analyse trends from different perspectives.
How To Trade Using a Heikin Ashi Forex Trading Strategy: Step-By-Step
A successful Heikin Ashi strategy follows a simple process: identify the trend, wait for confirmation, plan your trade, and manage risk. Following the same steps each time helps create consistency and removes emotion from decision-making.
Identify The Overall Market Trend
Start on a higher timeframe, such as the daily or H4 chart. Long runs of the same-coloured candles usually indicate a strong trend, while alternating colours often signal consolidation. If there is no clear direction, it is generally better to wait.
Wait For Heikin Ashi Trend Confirmation
Move to your trading timeframe (H1 or M15) and look for two or three consecutive candles in the same direction, strong bullish candles with little or no lower wick, or strong bearish candles with little or no upper wick.
Plan Trade Entries And Exits
Enter at the open of the next candle using the actual market price, never the averaged Heikin Ashi value. Factor in Forex spreads, since wider spreads in low-liquidity periods raise the cost of entry. For exits, watch for a colour change or small-bodied candles with wicks on both sides, and consider trailing stops to stay in strong trends.
Manage Risk And Position Size
Risk management remains essential, regardless of how strong a setup looks. Place stop-loss orders using real price levels such as support and resistance zones or recent swing highs and lows rather than Heikin Ashi candle values.
As a general guideline, many traders risk no more than 1% to 2% of their account balance on a single trade to keep Forex drawdown within manageable limits. Tools such as the Taurex Economic Calendar and Signal Centre can also help traders avoid entering positions immediately before major market events.
Popular Heikin Ashi Trading Strategies
Heikin Ashi candles can be used in several ways, depending on your trading style and preferred indicators. Here are four of the most common approaches.
Trend-Following Strategy
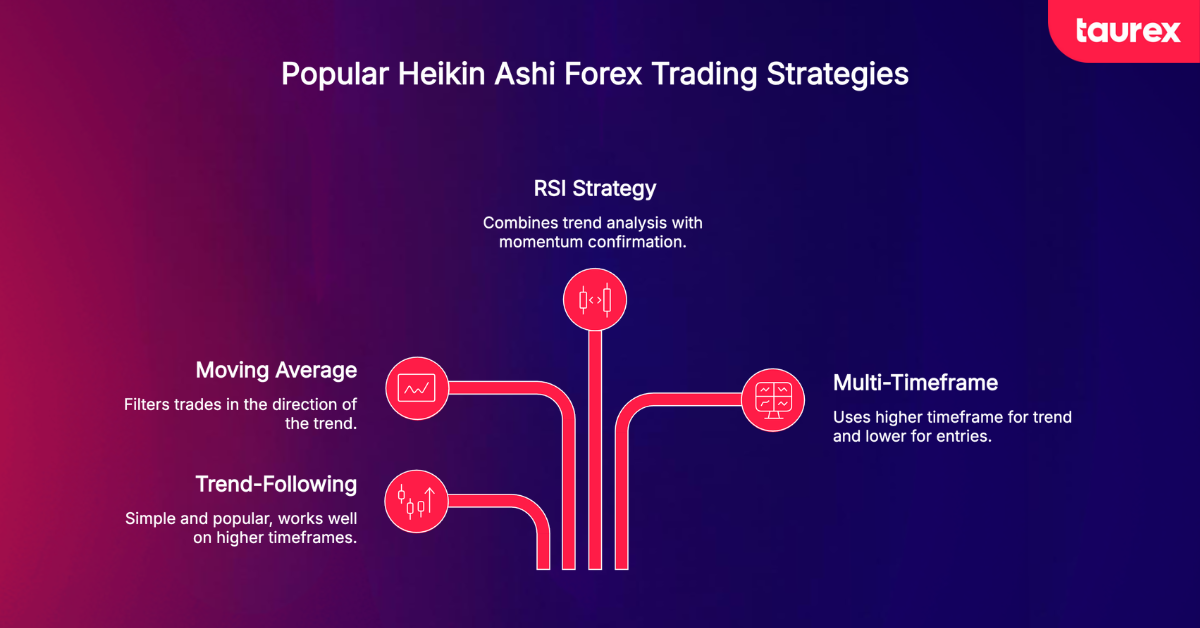
This is the simplest and most popular Heikin Ashi strategy. Traders enter when the candle colour changes, and momentum is confirmed by the absence of opposing wicks. The position remains open while candles continue to print in the same colour and closes when the trend begins to weaken or reverse.
This approach works particularly well on the H4 and daily timeframes, where market noise is less pronounced. Some traders also watch for price gap trading strategies at the start of a new session, using Heikin Ashi colour and wick structure to confirm whether the gap direction aligns with the broader trend.
Heikin Ashi And Moving Average Strategy
Combining Heikin Ashi with a moving average helps filter trades in the direction of the broader trend. Many traders use a 50-period or 200-period moving average, looking for long opportunities when the price is above the average and short opportunities when the price is below it.
For more active traders, a 9-period and 21-period EMA crossover can provide additional entry confirmation.
Heikin Ashi And RSI Strategy
This strategy combines trend analysis with momentum confirmation. Heikin Ashi candles help identify the trend, while RSI helps highlight potential entry points.
For bullish setups, traders often look for RSI to recover from oversold conditions while green Heikin Ashi candles begin to form. For bearish setups, RSI moving lower from overbought territory alongside red candles can provide confirmation. Traders also watch for divergence between RSI and price, a core concept behind many divergence trading strategies, as it can signal weakening momentum and a potential trend reversal before it becomes obvious on the chart.
Multi-Timeframe Heikin Ashi Strategy
This approach uses a higher timeframe, such as the daily or H4 chart, to determine the primary trend and a lower timeframe, such as H1 or M15, to refine entries.
Some traders use Heikin Ashi on the higher timeframe for trend direction and switch to traditional candlesticks on the lower timeframe for more precise execution. This works well alongside techniques like opening range breakout entries, combining the trend-filtering benefits of Heikin Ashi with the detailed price information provided by standard candlestick charts.
How To Use Heikin Ashi With Other Forex Indicators
Heikin Ashi charts are most effective when combined with other technical tools. While they identify trend direction, indicators provide extra confirmation for entries, exits, and reversals.
Moving averages: When candles stay above averages such as the 50 SMA, 200 SMA, or 21 EMA, the market is generally bullish; below them, bearish.
MACD: A bullish MACD crossover alongside strong green candles strengthens a long; a bearish crossover supports a short. A weakening histogram as candle bodies shrink signals fading momentum.
RSI: Useful for spotting overbought and oversold conditions, and RSI divergence can reveal a weakening trend before a change becomes visible.
Support and resistance: Draw these levels on the standard price chart, then use Heikin Ashi to confirm direction. A strong candle breaking a key level offers firmer confirmation than price action alone.
Heikin Ashi Candles vs Regular Candles
So how do Heikin Ashi candles vs regular candles actually compare? The table below lays out the core differences side by side.
| Feature | Heikin Ashi | Traditional Candlesticks |
| Price Displayed | Averaged (not real prices) | Raw OHLC prices |
| Trend Clarity | High, smoother, and cleaner | Lower, more noise |
| Reversal Speed | Slower (lagging) | Faster (real-time) |
| Pattern Recognition | Limited (classic patterns obscured) | Full range of candlestick patterns |
| Noise Filtering | Excellent | Minimal |
| Best Suited For | Trend-following, swing trading | Scalping, precise price action entries |
| Stop-Loss Placement | Must use a real price chart | Can use candle levels directly |
Heikin Ashi offers greater trend clarity, while traditional candlesticks provide more precise price information. Neither is inherently better. Heikin Ashi charts are often preferred for identifying and following trends, whereas traditional candlesticks are better suited to timing entries and exits. As a result, many traders use both together to get a clearer view of market direction while maintaining precise execution.
Advantages And Disadvantages Of Heikin Ashi Trading
Heikin Ashi charts can make trend analysis much easier, but they also come with limitations that traders need to understand. Knowing both sides helps you decide when the technique is most useful and when a traditional candlestick chart may be the better choice.
| Advantages | Disadvantages |
| Reduces market noise and filters out many false signals | Does not display actual market prices |
| Makes trends easier to identify and follow | Can be slower to signal trend reversals |
| Helps traders stay in strong trends for longer | Traditional candlestick patterns are harder to recognise |
| Can reduce emotional and reactive trading decisions | Less effective in sideways or range-bound markets |
| Works across multiple timeframes and currency pairs | Heikin Ashi highs and lows may not reflect real trading levels |
| Provides a cleaner visual view of market direction | Stop-loss and take-profit levels should be based on actual price charts |
For many Forex traders, the solution is not choosing one chart type over the other. Instead, they use Heikin Ashi for trend analysis and traditional candlesticks for precise entries, exits, and risk management decisions.
Common Mistakes Traders Make With Heikin Ashi
Heikin Ashi can make trends easier to spot, but it is not foolproof. Avoiding these common mistakes can help you use the technique more effectively.
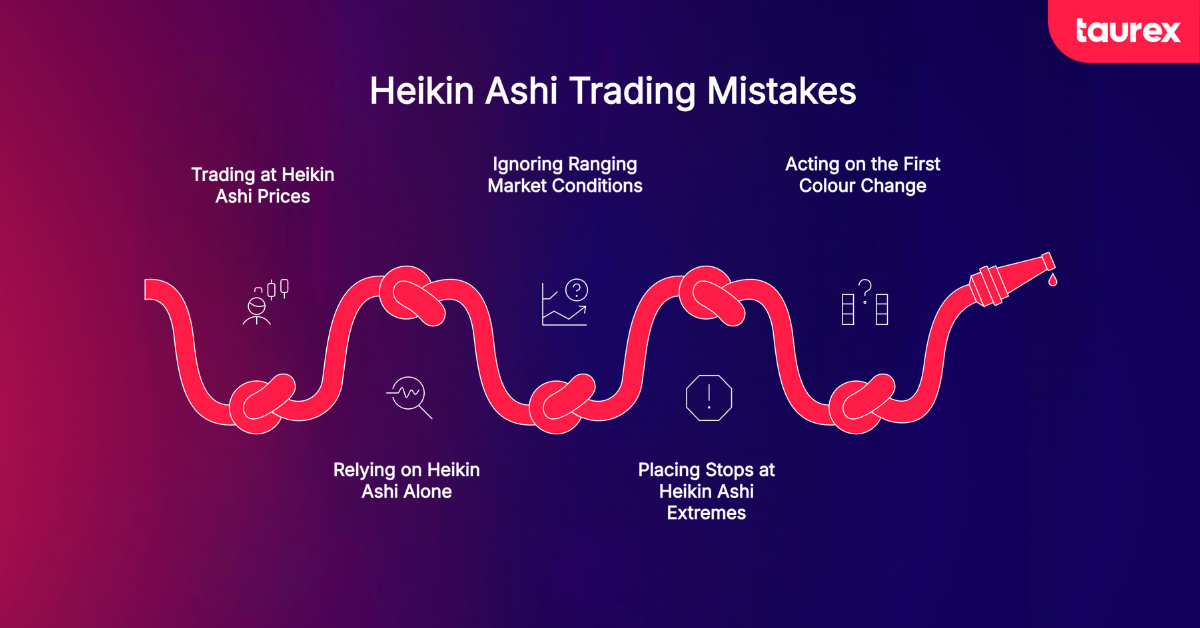
- Trading at Heikin Ashi prices: The open and close are averages, not real prices; always execute at actual market prices.
- Relying on Heikin Ashi alone: It works best with RSI, MACD, moving averages, or support and resistance.
- Ignoring ranging conditions: The technique is built for trending markets and weakens when the price moves sideways.
- Placing stops at Heikin Ashi extremes: Base stops on real price levels such as support, resistance, or recent swing points.
- Acting on the first colour change: A single colour change is not always a genuine reversal; wait for two or three candles in the new direction. Jumping back in too soon after a loss can also lead to revenge trading, which compounds mistakes rather than correcting them.
Final Thoughts
Heikin Ashi is a useful tool for traders who want a clearer view of market trends and less distraction from short-term price swings. It makes trend identification easier, but it works best when combined with indicators such as moving averages, RSI, or MACD and supported by sound risk management.
With Taurex, you can access Heikin Ashi charts directly on MT4 and MT5, alongside tools such as Signal Centre, Technical Views, and AI News Sentiment to support your analysis. If you are new to the technique, a free Taurex demo account allows you to practise in real market conditions before trading live.
FAQ
What is the Heikin Ashi Forex trading strategy?
The Heikin Ashi Forex trading strategy uses averaged candlestick data to identify trending market conditions. Traders typically enter long positions when consecutive green candles without lower wicks appear and short positions when red candles without upper wicks form. Many combine these signals with indicators such as RSI or moving averages for additional confirmation.
Is Heikin Ashi better than other candlestick charts?
Neither is universally superior. Heikin Ashi is better suited to trend-following and filtering market noise, while traditional candlestick charts provide more precise price information and make classic chart patterns easier to identify. Many traders use both together.
What indicators work best with Heikin Ashi?
Moving averages, RSI, and MACD are among the most commonly used indicators alongside Heikin Ashi. Support and resistance levels can also help confirm trend direction, breakouts, and potential reversals.
Does Heikin Ashi repaint?
No. Once a Heikin Ashi candle closes, it does not repaint or change. However, the current candle will continue to update until the trading period ends, just like a standard candlestick.
What timeframe is best for Heikin Ashi trading?
Heikin Ashi can be used on any timeframe, but many traders prefer the H1, H4, and daily charts because they provide clearer trends and fewer false signals. It is commonly used on major currency pairs such as EUR/USD and USD/JPY.
Can beginners use Heikin Ashi for Forex trading?
Yes. Heikin Ashi is often considered beginner-friendly because its smoother price action and colour-coded candles make trends easier to identify. New traders should still practise on a demo account before trading with real capital.
Is Heikin Ashi good for day trading?
Yes. Heikin Ashi can be effective for day trading, particularly on the M15, M30, and H1 timeframes. Many day traders combine it with momentum indicators such as RSI or MACD to improve signal quality.
What are the disadvantages of Heikin Ashi charts?
The main drawbacks are that Heikin Ashi does not display actual market prices, can be slower to signal reversals, makes traditional candlestick patterns harder to recognise, and tends to be less effective in range-bound markets.

