

Forex prices don’t move in a straight line. Even during a strong trend, the market often moves up, pauses, pulls back, and then continues in the same direction. These short moves against the main trend are called pullbacks, and they often create good trading opportunities.
A pullback trading strategy helps traders enter the market at a better price instead of chasing it at the top or bottom. Rather than buying after a big move up or selling after a sharp drop, traders wait for the price to retrace before entering.
In this guide, you’ll learn what a pullback is, how the pullback trading strategy works in Forex, simple entry and exit rules, and the mistakes to avoid.
What Is A Pullback In Trading?
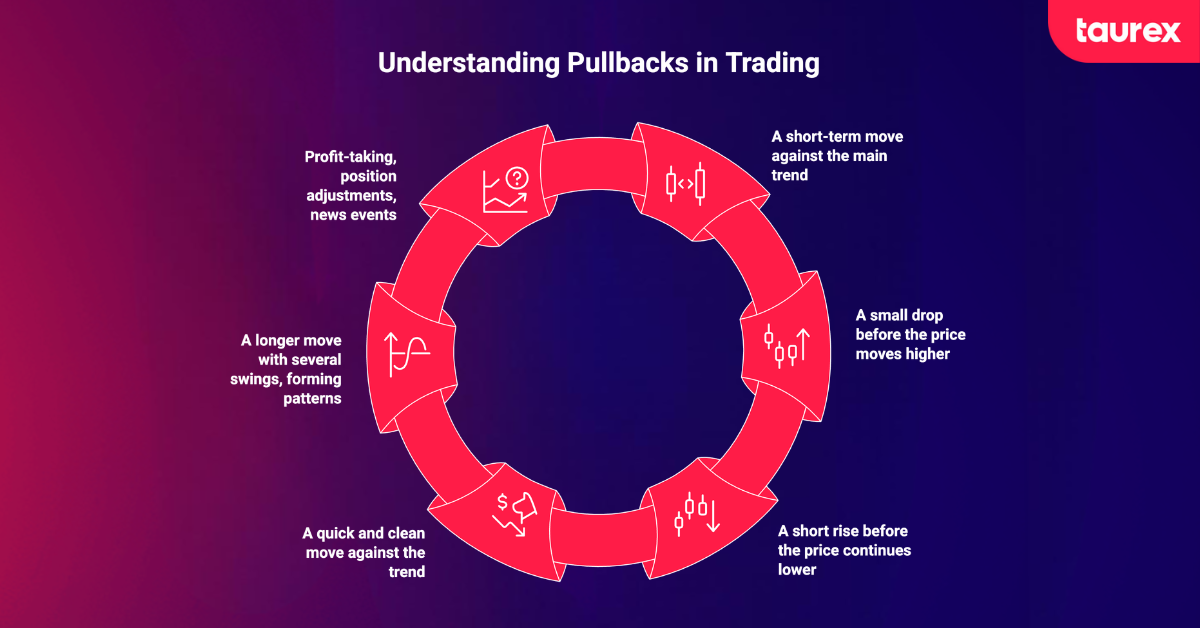
A pullback is a short-term move against the main trend. It happens when the market briefly moves in the opposite direction before continuing the overall trend. Think of it as a pause in price movement.
In an uptrend, a pullback looks like a small drop before the price moves higher again. In a downtrend, it is a short rise before the price continues lower. Traders may also call it a retracement or correction.
Pullbacks can be simple or complex:
- A simple pullback is quick and clean, with the price briefly moving against the trend before continuing.
- A complex pullback lasts longer and includes several swings, often forming patterns like flags or triangles. Complex pullbacks are harder to tell apart from real reversals.
They usually happen because traders take profits, large players adjust positions, or small news events temporarily affect sentiment without changing the main trend.
Why Is Pullback Trading Important For Forex Traders?
Forex markets run 24 hours a day, five days a week, and prices are constantly moving across different trading sessions. Because of this, pullbacks happen often, even in strong trends, which makes the pullback trading strategy a practical approach for Forex traders.
There are a few key reasons why it matters. First, it allows traders to enter at better prices instead of buying after a big rise or selling after a big drop. Second, entries near support or resistance levels usually mean smaller stop-losses, which can improve the risk-to-reward ratio.
Third, traders are still following the direction of the main trend, which can improve the chances of staying aligned with broader market momentum. However, not every pullback turns into a valid continuation setup. Failed pullbacks happen when the price retraces, appears to hold a key level, but then breaks against the trend and signals a deeper reversal or range-bound market.
This is why confirmation matters. Traders should look for signs that the pullback is holding, such as price rejection, trendline support, moving average confluence, or momentum returning in the direction of the trend.
Platforms like Taurex provide real-time charts and indicators that help traders spot pullback setups as they form across pairs like EUR/USD or GBP/JPY.
How Does the Pullback Trading Strategy Work In Forex?
Pullback trading strategy follows a simple five-step process. The idea is to wait for the price to move against the trend briefly, then enter when the trend continues. Each step matters, and skipping one can increase risk.
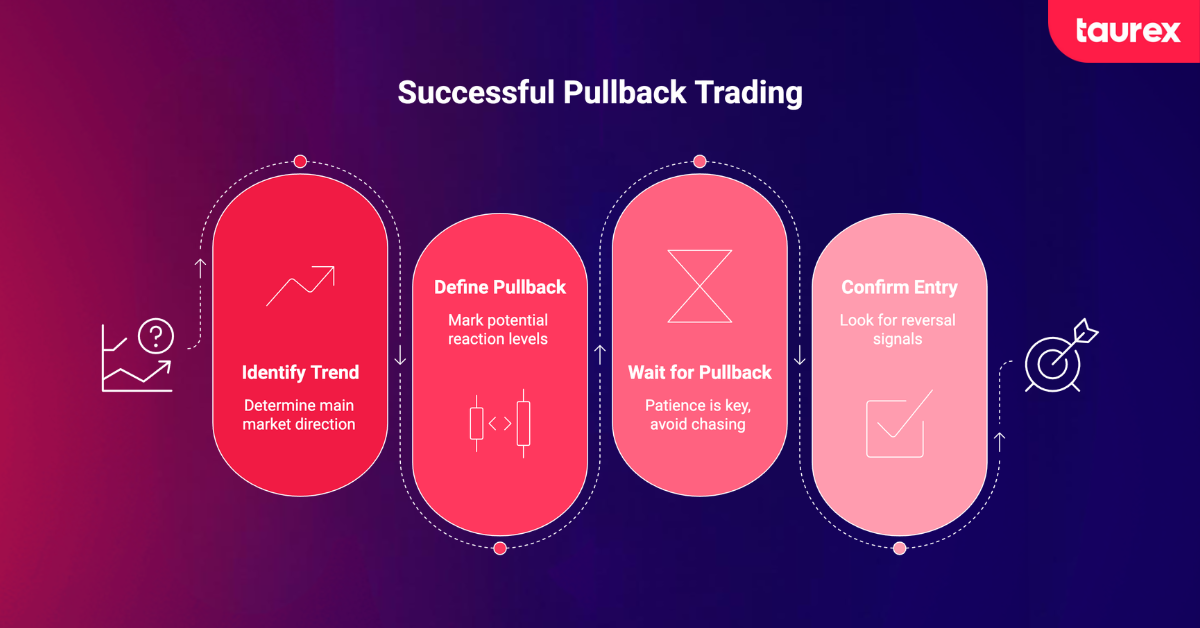
Identify The Trend
Start by checking a higher timeframe like the H4 or Daily chart to see the main direction. In an uptrend, the price makes higher highs and higher lows. In a downtrend, it makes lower highs and lower lows. Tools like trendlines and moving averages, such as the 20, 50, or 200 EMA, can help confirm the trend.
Define Pullback Criteria
Next, mark areas where the price may pull back and react. These can be support and resistance zones, moving averages, or Fibonacci levels between 38.2% and 61.8%. Planning these levels helps you avoid emotional decisions later.
Wait For Pullback
This step is where discipline matters most. Don’t chase the market. Wait for the price to come back to your level. A healthy pullback often shows smaller candles, lower momentum, and mixed price movement. This usually means the trend is still intact.
Confirm The Entry
A level alone is not enough. Look for confirmation like a strong reversal candle (pin bar or engulfing candle) or indicators such as RSI moving out of oversold or overbought areas. When multiple signals align, the setup becomes stronger.
Trade In The Direction Of The Trend
Once confirmed, enter the direction of the main trend. Place your stop-loss below the recent swing low in an uptrend or above the swing high in a downtrend. Aim for a clear target, usually at least a 1:1.5 risk-to-reward ratio or the previous swing level.
Real-World Example Of Pullback Trading Strategy
Here is a pullback trading strategy example that illustrates how confluence works in practice. EUR/USD is in a clear uptrend on the 4-hour chart. Price is above the 50 EMA and making higher highs and higher lows, showing strong buyer control.
After a strong move up, the price pulls back to the 61.8% Fibonacci level, which also lines up with the 50 EMA. This creates a confluence zone where two tools point to the same area.
During the pullback, volume drops, suggesting it is a temporary correction rather than a reversal. Then a bullish engulfing candle forms at that level, showing buyers are stepping back in. The entry is placed above the engulfing candle. The stop-loss goes below the Fibonacci level, and the target is the previous swing high.
This type of setup is considered stronger because multiple signals align in the same zone.
Taurex’s built-in Fibonacci tool and customizable EMA indicators make it straightforward to plot these zones on any pair, from GBP/USD to AUD/USD.
Pros And Cons Of Pullback Trading Strategy In Forex
Like any strategy, the pullback trading strategy has clear strengths and honest limitations.
| Pros | Cons |
| Better entry prices instead of chasing the market | Requires patience to wait for valid setups |
| Tighter stop-loss placement near key levels | Pullbacks can turn into full trend reversals |
| Trading with the trend improves the probability | Less effective in sideways or choppy markets |
| Clear, rule-based structure is easy to follow | Needs multi-timeframe analysis for best results |
| Helps avoid buying highs and selling lows | Missed opportunities when price runs without pulling back |
Taurex’s multi-timeframe chart views and real-time alerts help offset several of these challenges by keeping you informed without being glued to the screen.
5 Best Pullback Trading Strategies For Forex Traders
There is no single “perfect” pullback strategy. The best approach depends on your trading style, timeframe, and the tools you use. Below are five of the most commonly used and reliable methods.
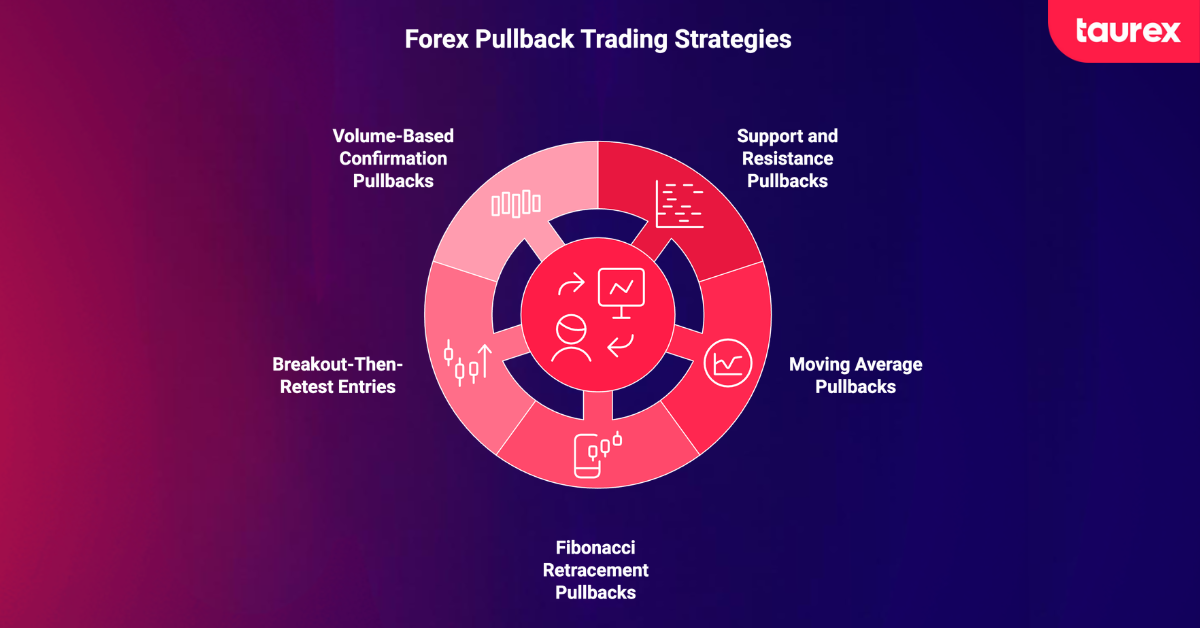
Support And Resistance Pullbacks
This is one of the simplest and most popular methods. You mark key support and resistance levels, then wait for the price to pull back to them during a trend.
When the price reaches the level, look for a rejection candle, like a pin bar or engulfing candle, before entering. Place your stop-loss just beyond the level. This works best for traders who prefer clean price action.
Moving Average Pullbacks
This strategy uses moving averages like the 20 EMA or 50 EMA as dynamic support and resistance.
In a trend, price often pulls back to these levels before continuing. You wait for the price to touch the EMA and show a reversal signal before entering. This works well on major pairs like EUR/USD and GBP/USD. Platforms like Taurex allow you to easily customise EMA settings across timeframes.
Fibonacci Retracement Pullbacks
This method uses Fibonacci retracement levels to identify potential pullback zones. Traders often focus on key areas within the retracement structure, with particular attention given to the commonly watched “golden zone.”
These levels are widely followed in the market and often act like support or resistance because many traders react to them. In strong trends, price frequently pulls back into these areas before continuing in the main direction. The strongest setups usually appear when Fibonacci levels align with other technical areas such as support and resistance zones or moving averages.
Breakout-Then-Retest Entries
In this strategy, price first breaks a key level, then comes back to retest it.
Resistance becomes support after a breakout, and support becomes resistance after a breakdown. The structure is simple: breakout, pullback, confirmation.
Enter when the price shows rejection at the retested level, and place your stop beyond the broken zone. Higher volume on the breakout and lower volume on the retest can strengthen the signal.
Volume-Based Confirmation Pullbacks
This strategy uses volume to confirm whether a pullback is healthy or not.
If volume increases during the pullback, it may signal a potential reversal instead. In Forex, traders often use tick volume as a reference. Taurex provides volume tools that help confirm these setups.
Entry, Exit, And Stop Loss Rules For Pullback Trading
Clear rules help remove guesswork from a pullback trading strategy and make your decisions more consistent.
Entry Rules
Only trade in the direction of the confirmed trend. Wait for the price to reach a key level such as a moving average, Fibonacci zone, or support and resistance area. Then look for a confirmation signal, like a strong candle reversal, before entering.
You can either place a limit order at the level in advance or enter with a market order after the confirmation candle closes.
Stop-Loss Rules
Place your stop-loss below the recent swing low in an uptrend or above the recent swing high in a downtrend. The stop should be placed beyond the technical level, not at a random pip distance. More volatile pairs like GBP/JPY usually need wider stops than calmer pairs like EUR/USD.
Exit Rules
A common approach is to target the previous swing high in an uptrend or the next major resistance level. Many traders also scale out, closing part of the position at the first target and letting the rest run with a trailing stop.
Aim for at least a 1:1.5 to 1:2 risk-to-reward ratio for each trade.
At Taurex, we offer limit orders, stop losses, and trailing stops, which help you apply these rules more consistently.
Risk Management Rules For Pullback Trading
No pullback strategy works without strong risk management. This is what keeps you in the game long term.
Risk only 1–2% of your account on any single trade. This ensures that even a losing streak will not significantly damage your capital. Never widen your stop-loss after entering a trade just to avoid being stopped out, as this breaks the original trading plan and increases risk unnecessarily.
Consistent position sizing and a solid risk-to-reward ratio are key factors in long-term trading discipline.
It also helps to use multiple timeframes to filter weaker setups and avoid trading during high-impact news events like FOMC meetings or NFP, when prices can move unpredictably and break technical levels quickly. Not every pullback is a valid setup, so only take trades that form at key confluence zones with clear confirmation.
Taurex provides a position size calculator that helps you manage trading risks based on your account balance and stop-loss distance. This makes it easier to stay consistent with your risk on every setup.
Common Mistakes In Pullback Trading And How To Avoid Them
Pullback trading can be very effective, but only if it is applied correctly. Many traders lose money not because the strategy is wrong, but because of simple execution mistakes. Here are the most common ones to avoid:
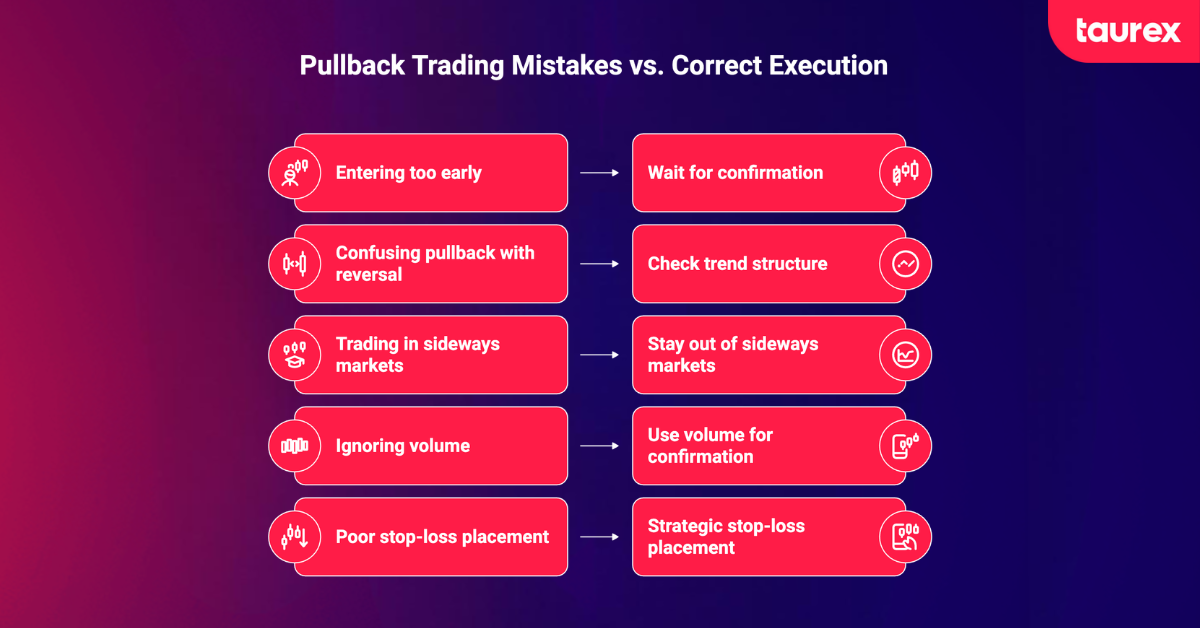
- Entering too early
Many traders jump in as soon as the price touches a level. Without a confirmation candle, this is just guessing. Wait for clear confirmation before entering. - Confusing a pullback with a reversal
This is one of the most costly mistakes. Always check if the trend structure is still intact (higher highs and higher lows in an uptrend). If price breaks the previous swing low in an uptrend, it may be a reversal, not a pullback. Not all pullbacks continue, and some turn into full reversals. - Trading in sideways markets
Pullback strategies only work well in clear trends. If the market is ranging and no clear direction is visible, it is better to stay out. - Ignoring volume
Volume helps confirm whether the pullback is healthy. Falling volume during a retracement usually supports the trend, while rising volume can signal a potential reversal. - Poor stop-loss placement
Placing stops too tight just to improve risk-to-reward often leads to early stop-outs. Stops should be placed beyond key swing levels, not at random pip distances.
What Is The Difference Between A Pullback And Reversal?
Both involve price moving against the prevailing trend, but the outcome is entirely different. A pullback is temporary. The trend remains intact, volume drops during the retracement, price respects key levels, and the original direction resumes. It’s worth noting that pullbacks usually last only a few trading sessions.
A reversal, by contrast, is a permanent change in direction. Key support or resistance levels break, volume spikes, and a new trend begins.
Here is a four-point diagnostic checklist you can use:
- Is the correction shallow, less than 50% of the last move? If yes, that leans towards a pullback.
- Is a major support or resistance level being respected? If yes, another point for a pullback.
- Did volume decrease during the counter-trend move? Declining volume supports a pullback reading.
- Was the last major higher low (in an uptrend) or lower high (in a downtrend) broken? If yes, that is a reversal signal.
TradeTaurex’s multi-timeframe chart view makes it straightforward to cross-verify trend structure across timeframes before committing to any trade, which is one of the most effective ways to tell the difference in real time.
Conclusion
Pullback trading is one of the most practical ways to trade Forex trends because it helps you enter the market at better prices instead of chasing moves. The key is not just spotting pullbacks, but understanding context, waiting for confirmation, and managing risk properly. When used with discipline, it becomes a structured approach that works across different pairs and timeframes.
The best way to improve your pullback trading skills is to practise them in real market conditions without risking capital.
Open a demo account with Taurex and test pullback setups using live charts, indicators, and risk management tools in a realistic trading environment.
FAQ
Is pullback trading profitable?
Pullback trading can be profitable when used in trending markets with clear entry rules and proper risk management. Many traders report win rates of around 55% to 65% with a risk-to-reward ratio of 1:1.5 to 1:2. However, results vary, and every trade still carries risk.
How do you identify a pullback in Forex?
A pullback is a temporary move against the trend. It usually stays within the overall trend structure and shows signs like smaller candles, lower momentum, and reduced volume. Price often retraces toward key levels such as moving averages, Fibonacci zones, or support and resistance areas.
What is an example of a pullback strategy in Forex?
A common example is the moving average pullback. In an uptrend, price pulls back to the 50 EMA, forms a bullish engulfing candle, and then continues upward. Traders enter above the candle high, place a stop below the EMA, and target the previous swing high.
What is the pullback method?
The pullback method is a trading approach where you wait for the price to retrace within a trend before entering. Instead of chasing momentum, you wait for the price to reach a key level and enter once confirmation shows the trend is resuming.
Is pullback trading good for beginners in Forex trading?
Yes, it can be beginner-friendly because it follows clear rules for entry and stop-loss placement. The main difficulty is learning to tell the difference between a pullback and a reversal, which improves with practice and chart experience.
Which indicators work best for pullback trading?
Common tools include the 20 and 50 EMA for dynamic support and resistance, Fibonacci retracements for pullback zones, and RSI for momentum signals. Volume can also help confirm whether a pullback is healthy or likely to reverse.
What timeframe is best for pullback trading in Forex?
There is no single best timeframe. Day traders often use the 1-hour or 4-hour charts, while swing traders prefer the daily chart. A multi-timeframe approach works best, where you confirm the trend on a higher timeframe and time entries on a lower one.

