
Key Points
- The Fed’s rate decision lands today, 16 September, at 18:00 UTC, with the statement and economic projections released alongside it and Chair Warsh’s press conference following at 18:30 UTC. A 25 basis point hike, taking the Federal Funds Rate from 3.50 to 3.75% up to 3.75 to 4.00%, is close to fully priced, with rate markets showing a 91.4% probability of a move.
- Gold is trading at 4,328, consolidating just above the 4,280 to 4,320 demand zone after a sharp break of structure carried price down from a weak high above 4,720. The 10 year Treasury yield breaking above 5% for the first time since 2007 has been the dominant pressure on the metal heading into today’s decision.
- EUR/USD is trading at 1.1543, having broken down from a weak high near 1.1710 through a sequence of bearish structure shifts. With the hike itself close to fully priced, it is the tone of the statement and the dot plot, not the decision itself, that carries the real potential to move the pair today.
What Is the Fed Decision?
The Federal Open Market Committee, or FOMC, meets eight times a year to set the Federal Funds Rate, the interest rate at which banks lend to each other overnight. It is arguably the single most important recurring event on the financial calendar, because that rate ripples through the cost of borrowing across the entire US economy, from mortgages to corporate debt, and directly shapes the relative appeal of holding dollars versus other currencies.
Today’s meeting concludes with three things landing at once: the rate decision itself, the FOMC statement explaining the Committee’s reasoning, and updated economic projections, including the closely watched dot plot showing where individual policymakers expect rates to head over the next few years. Chair Warsh’s press conference, thirty minutes later, is often where the real market reaction happens, as reporters probe for detail the statement itself does not spell out.
As with any fully priced event, markets do not react much to the headline number if it matches expectations. What moves price is the gap between what was priced in and what actually arrives, whether that is the size of the move itself, the tone of the statement, or the shape of the dot plot for future meetings.
What to Expect Today
A 25 basis point hike, lifting the Federal Funds Rate from the current 3.50 to 3.75% range up to 3.75 to 4.00%, is close to fully priced, with rate markets showing a 91.4% probability of a move as of today. That leaves relatively little room for the decision itself to surprise markets, which is precisely why so much attention has shifted to the accompanying statement and the dot plot.
Context matters here more than usual. The 10 year Treasury yield has pushed above 5% for the first time since 2007, described in this morning’s coverage as the bond market sending a warning ahead of the Fed. That kind of yield spike heading into a hike is unusual, and it raises the stakes for how the Committee frames its outlook, particularly if the dot plot signals further tightening beyond today rather than a pause.
Gold: The Level That Decides Where This Goes Next
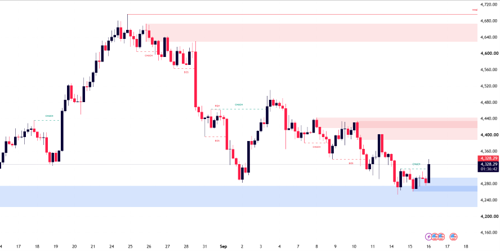
Chart: Gold Spot/USD, H1 timeframe (TradingView, SMC)
Zoom out and the shape of the month is clear. Gold rallied hard from a base near 4,250 in late August, punching through a series of breaks of structure to a weak high just above 4,720 by the end of the month. A bearish change of character confirmed there triggered a heavy reversal, and after a brief recovery attempt into the 4,380 to 4,440 zone was rejected, the decline extended further, with gold now trading at 4,328, sitting just above the 4,280 to 4,320 zone.
That zone held once already this week, and gold’s ability to hold it again today is the level that decides where this goes next. Rising Treasury yields have been the dominant pressure on the metal, and the 10 year crossing above 5% for the first time since 2007 has only intensified that. Gold pays no income, so it competes directly with bonds and cash, and when yields rise this sharply, holding gold means giving up an increasingly attractive alternative.
This is not a coincidence of timing. Price sitting on a key demand zone directly ahead of the one event capable of resolving the yield story is exactly the kind of setup this column exists to flag. A hawkish outcome that pushes yields higher still would put the 4,280 to 4,320 zone under real pressure, while a dovish surprise could spark a sharp recovery back toward 4,400.
EUR/USD: Caught Between Two Central Bank Stories
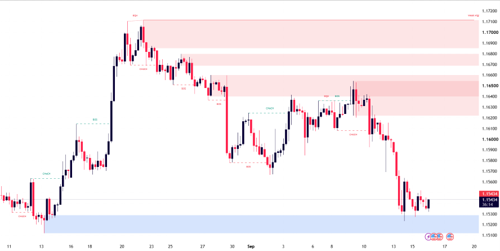
Chart: EUR/USD, H1 timeframe (TradingView, SMC)
EUR/USD tells a similar story of exhaustion. The pair rallied to a weak high near 1.1710 in the middle of last week, and a bearish change of character there kicked off a run of breaks of structure lower, taking price down through the 1.1640 to 1.1680 zone and extending the decline to its current level of 1.1543.
With today’s hike close to fully priced, the statement and dot plot carry the real weight for the dollar side of this pair. A hawkish signal on further tightening would likely extend the pair’s slide, while any hint that the Fed sees this as the last hike for now would give EUR/USD room to recover back toward the broken 1.1640 to 1.1680 zone.
Three Scenarios for Today
Hold, or a hike paired with a dovish dot plot
This is the low probability outcome given the 91.4% odds already priced in, but it would be the most disruptive if it landed. A hold, or a hike accompanied by a dot plot signalling this is the last move for a while, would likely send Treasury yields sharply lower off that 5% level, weaken the dollar, and spark a strong recovery in both gold and EUR/USD.
Hike delivered as expected, statement broadly balanced
The base case. With the move itself fully anticipated, a balanced statement and a dot plot that neither confirms nor rules out further hikes would likely produce a muted, two way reaction. Gold probably holds its current zone without much conviction either way, and EUR/USD stays rangebound as markets wait for the next catalyst.
Hike delivered with a hawkish dot plot signalling more to come
Given where yields already sit, this is the scenario markets seem most braced for. A dot plot pointing to further tightening into year end would likely push yields higher still, extend the dollar’s strength, and put real pressure on gold’s 4,280 to 4,320 zone and EUR/USD’s recent lows alike.
Risk Warning: Trading financial instruments, particularly those involving leverage, involves a substantial degree of risk and is not appropriate for all investors. The value of your investments can rise or fall sharply, and it is possible to lose the entirety of your invested capital. Do not trade with funds you cannot afford to lose. Nothing in this site should be read or construed as constituting advice on the part of Taurex or any of its affiliates, directors, officers or employees.