
Key Points
- US voters go to the polls today, 3 November, in the midterm elections, with all 435 House seats and 35 of 100 Senate seats up for election. Prediction markets price a Democratic House at about 90% and a full Democratic sweep at roughly two-thirds to three-quarters, results are due overnight into Wednesday, and the new Congress does not take office until 3 January, so markets are likely to trade the fiscal read-across more than the politics.
- The US Dollar Index is trading at 101.746, range-bound between 101.43 and 102.48 since its 14 October high near 102.94 and sitting below the 102.55 to 102.63 supply zone. A divided Congress is the base case, which ING and Convera both see as a mildly negative initial reaction for the dollar.
- The US 10-year Treasury yield is at 4.912%, down from a high near 5.36% in early October, with the 4.74% to 4.76% demand zone the next level below. The yield is the link between the election and other markets, because a result that raises fiscal spending expectations would lift it and one that limits them would let it ease.
What Are the US Midterm Elections?
The US midterm elections take place halfway through a president’s four-year term, with all 435 seats in the House of Representatives and 35 of the 100 Senate seats contested. They matter to markets because Congress controls government spending, taxes and borrowing, while the President keeps considerable authority over tariffs, foreign policy and regulation, so the result shapes how much room the administration has to pass new fiscal measures.
The market transmission runs in a chain. The result shapes expectations for fiscal policy and borrowing, which feeds into Treasury yields and Federal Reserve pricing, which in turn moves interest rate differentials and the US dollar, gold and equities. A Republican sweep would revive expectations of tax cuts and spending, lifting yields and the dollar, while a divided Congress would limit new fiscal expansion and leave less pressure on yields.
As with any scheduled event, what moves price is the surprise relative to what is priced in, and UBS notes the midterms should not be treated as a binary directional event, with growth, earnings, AI investment, inflation and interest rates likely to matter more over time. The base case of a Democratic Congress facing a Republican president is already widely expected, so a muted reaction is the most likely outcome.
What to Expect Today
Voting runs through Tuesday, with results expected Tuesday evening in the US and overnight, so the first market reaction lands in the Asian and European sessions on Wednesday. Prediction markets price the Democrats at about 90% to win the House, and UBS’s own probabilities are a 50% Democratic sweep, a 40% split Congress with Democrats taking the House and Republicans keeping the Senate, and a 10% Republican hold. Michigan’s Senate race has been flagged as a possible decider for Senate control.
History is a mixed guide. According to Admiral Markets’ review, the S&P 500 was higher 12 months after all 19 midterm elections since 1950, but the day after the vote has been inconsistent, up 2.1% in 2018 and down 2.1% in 2022. The calendar is also crowded: the Treasury’s quarterly refunding announcement is due around 4 November, the Bank of England decides on Thursday, US payrolls land on Friday, a December Fed hike is priced at about 80% to 87%, and government funding runs out on 11 December, so the election is one catalyst among several.
US Dollar Index (DXY): Range-Bound Below Supply Into the Vote
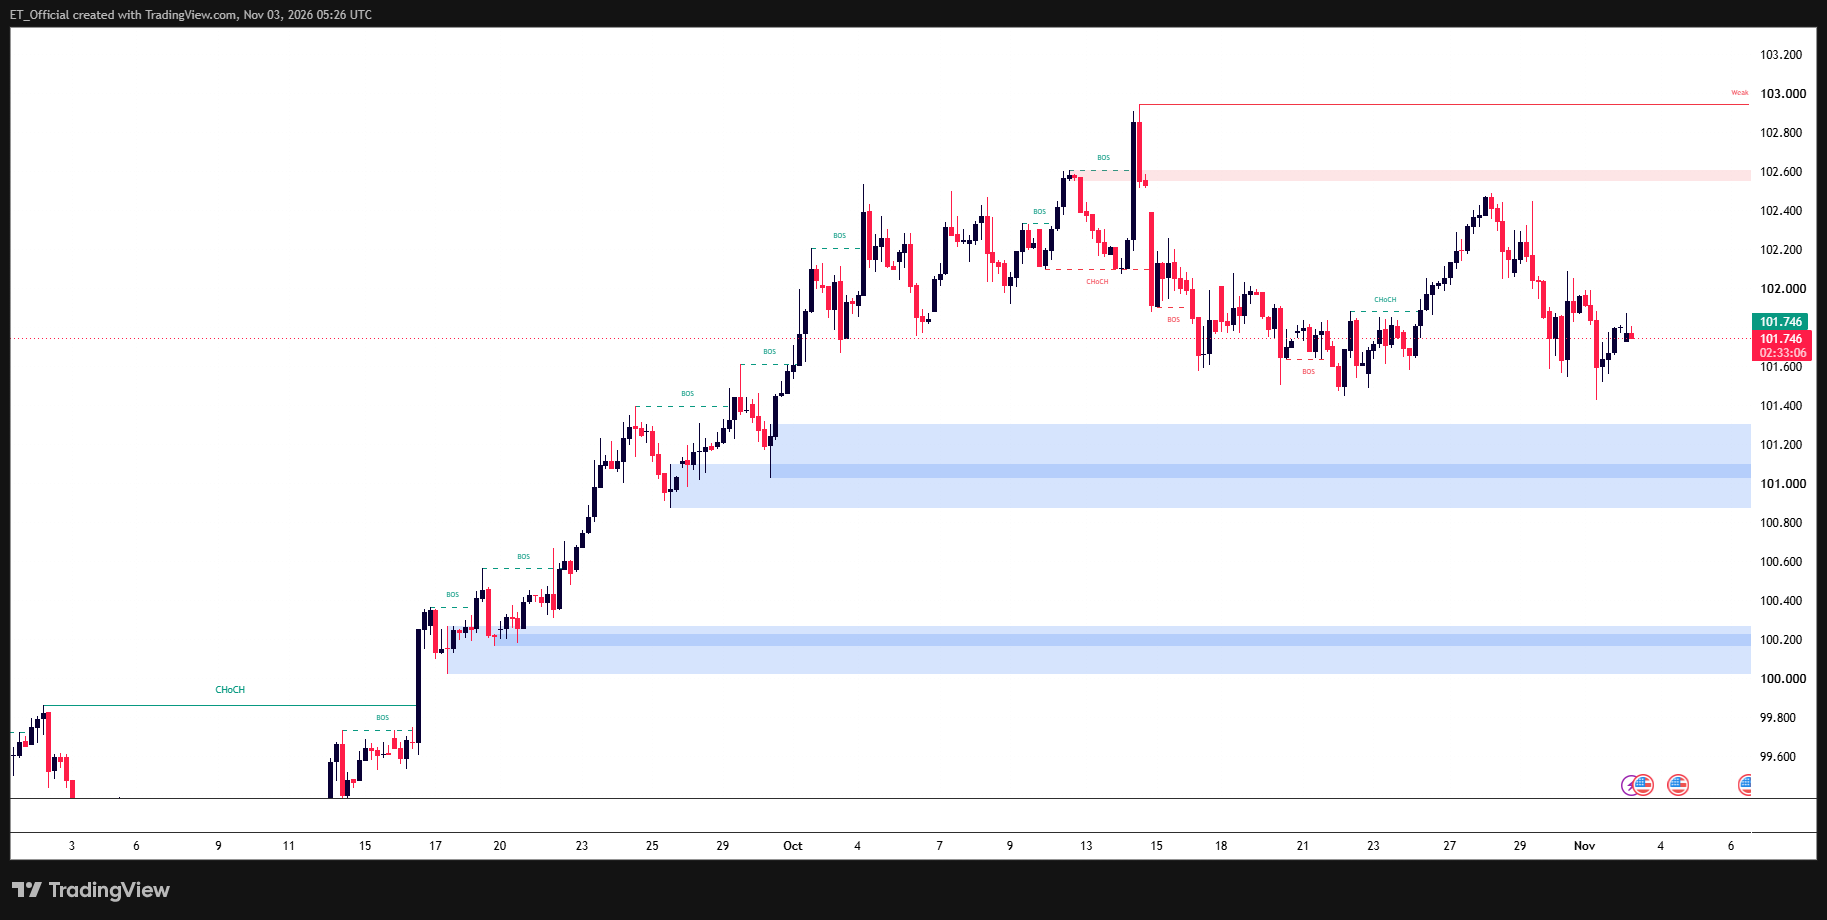
Chart: US Dollar Index (DXY), 4H timeframe (TradingView, SMC)
US Dollar Index (DXY) 4H chart, 2 September to 3 November 2026: the index rallied from near 100.0 in mid-September to a high near 102.94 on 14 October, then ranged between 101.43 and 102.48, and is trading at 101.746 below the 102.55 to 102.63 supply zone.
The 4H chart shows the dollar index rallying from the 100.03 to 100.27 demand zone in mid-September through a series of breaks of structure to a high near 102.94 on 14 October, the day of US CPI, before it was rejected and fell back. Since then it has ranged between 101.43 and 102.48, with a rally to 102.48 on 28 October failing below the 102.55 to 102.63 supply zone, and a drop to 101.43 on Monday holding the same low area as 22 October.
The index is a weighted basket of six currencies, with the euro making up about 58%, the yen about 14%, the pound about 12%, the Canadian dollar about 9%, the Swedish krona about 4% and the Swiss franc about 4%, so a view on the dollar index is really a view on those pairs. A divided Congress that means less fiscal stimulus and lower yields would favour a weaker dollar, and EUR/USD near 1.1164, close to its weakest since May 2025, and GBP/USD near 1.34 are the most direct ways to trade it.
Above, 102.48 and the 102.55 to 102.63 supply zone cap the upside, and a break of the 102.94 high would signal a new leg higher. Below, the 101.43 low is the level to watch, and a break would open the 100.88 to 101.30 demand zone, with 100.03 to 100.27 beneath it. A Republican surprise is the scenario most likely to push the index toward the top of the range.
US 10-Year Yield: Lower Highs Into the Election
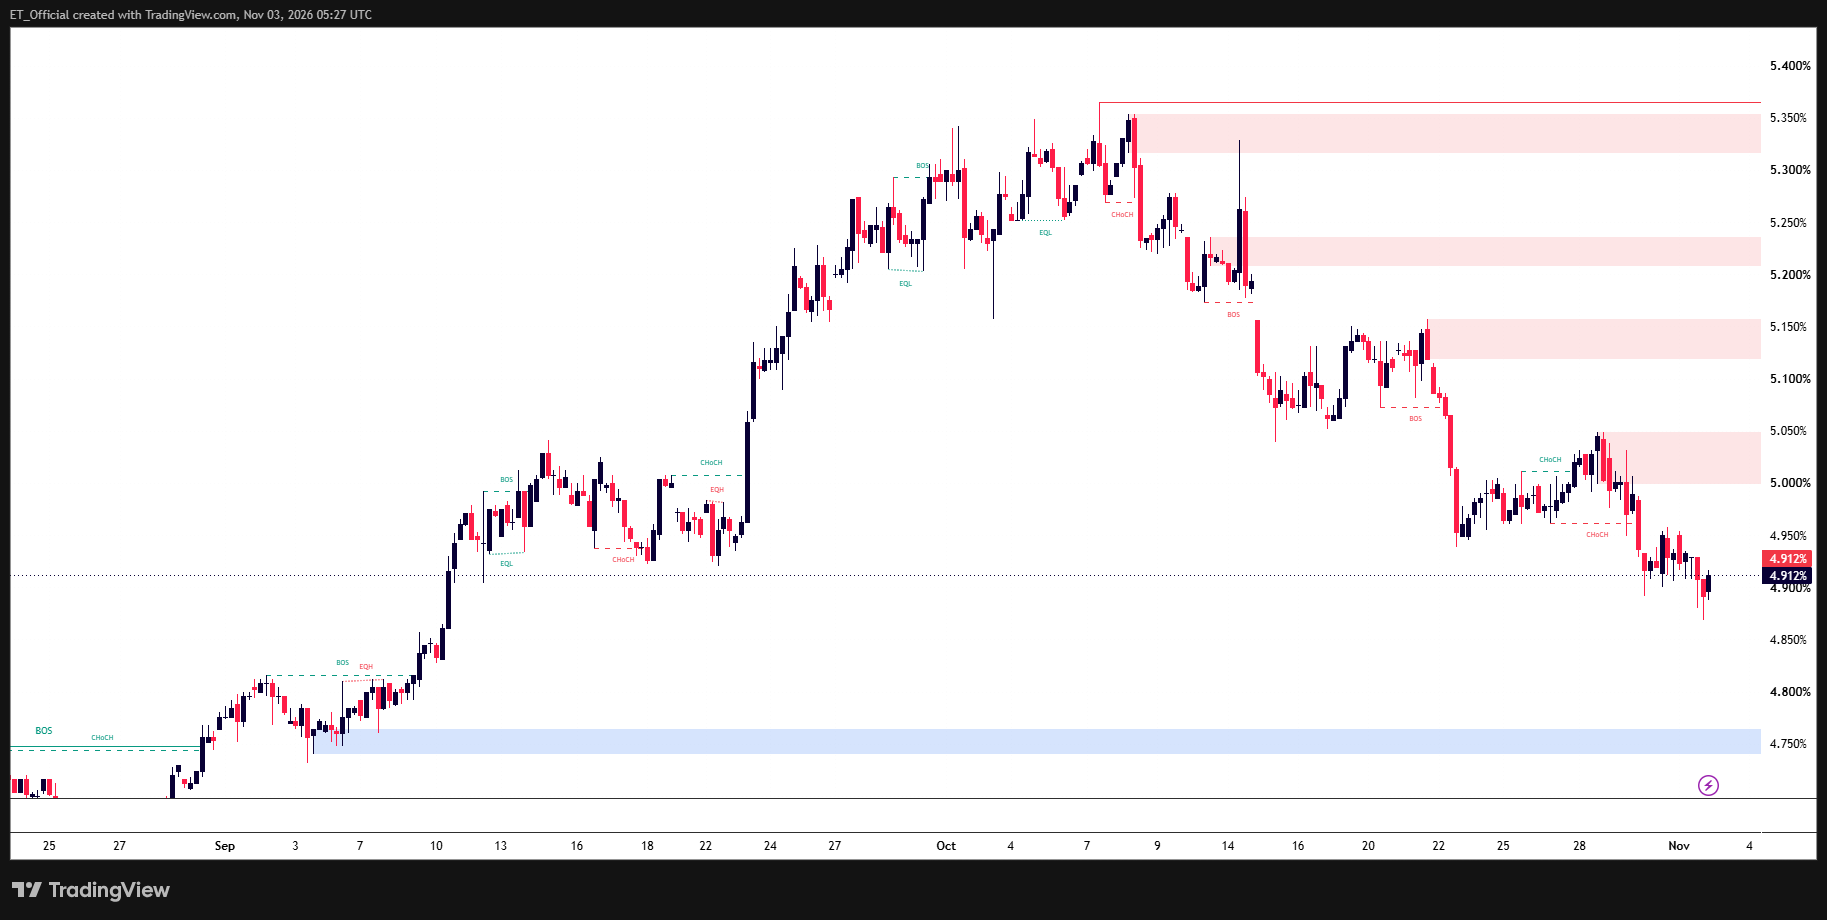
Chart: US 10-Year Treasury Yield, 4H timeframe (TradingView, SMC)
US 10-Year Treasury yield (US10Y) 4H chart, 24 August to 3 November 2026: yield rose from near 4.75% in early September to a high near 5.36% in early October, then fell through a series of lower highs to 4.912%, with demand at 4.74% to 4.76% below.
The 4H chart shows the yield rising from the 4.74% to 4.76% demand zone in early September, through 5.0% in late September, to a high near 5.36% in early October, before a break of structure sent it lower. Each rebound since has made a lower high, at 5.33% on 14 October, 5.16% on 21 October and 5.05% on 28 October, with supply at 5.32% to 5.36%, 5.21% to 5.24%, 5.12% to 5.16% and 5.00% to 5.05% capping each one.
The yield now sits at 4.912% after dropping below the 4.95% area to a low near 4.87%. Yields fell across the curve on Friday as the Nasdaq 100 dropped 3.5%, even though Fed speakers including Logan kept further hikes in play, which shows how much of the recent move reflects risk aversion and demand for Treasuries as well as rate expectations.
The 10-year yield is the channel through which the election reaches other markets. A rising yield tends to lift USD/JPY, the most yield-sensitive major pair, weigh on gold because it pays no income, and pressure growth-heavy indices such as the US100 by raising the discount rate on future earnings, while a falling yield tends to do the opposite. If the result lowers fiscal expectations the yield could extend toward the 4.74% to 4.76% demand zone, and if it raises them it would likely retest the 5.00% to 5.05% supply.
How to Trade These Views on Taurex
The dollar index and the 10-year yield are signals more than instruments, so the practical way to act on a view is through the Taurex markets they drive. A weaker dollar view maps to buying EUR/USD and GBP/USD, selling USD/JPY, USD/CAD and USD/CHF, and supporting gold (XAU/USD), while a stronger dollar view is the reverse. A falling yield view points the same way for the dollar pairs and gold and also supports growth indices such as the US100, with USD/JPY the cleanest yield proxy, while a rising yield view favours buying USD/JPY, selling gold and pressure on the US100.
Because these markets often move together, a weaker dollar position in EUR/USD, GBP/USD and gold at the same time is closer to one trade counted three times, so size the risk as a single position. Event nights bring wide spreads and gaps, so set the stop before entry and use smaller size than normal. Taurex offers forex, indices, metals and commodities CFDs from one account, so these markets can be traded side by side.
Three Scenarios for the Result
Democratic sweep: divided government, less fiscal stimulus
A sweep fits the base case of divided government and would likely bring a mildly negative initial reaction for the dollar, with less room for party-line fiscal expansion and some relief for long-term yields. The dollar index would likely drift toward the 101.43 low, where a break would open the 100.88 to 101.30 demand zone, while the 10-year yield could ease toward 4.87% and then the 4.74% to 4.76% demand zone. On Taurex that favours EUR/USD and GBP/USD higher, USD/JPY lower and gold supported, with the US100 mixed because of the scrutiny on technology.
Split Congress: Democrats take the House, Republicans hold the Senate
The least disruptive outcome, which UBS puts at 40% and other sources nearer 27%. Fiscal surprises would be limited, so the dollar index would likely stay inside the 101.43 to 102.48 range and the 10-year yield between about 4.87% and 5.05%, with Friday’s payrolls and the Fed’s December path regaining control. In a range, waiting for a break of 101.43 or 102.48 is more reliable than trading the election headline.
Republican hold or a contested result
Republicans keeping the House, priced at roughly 10%, would break the gridlock assumption and revive expectations of tax cuts and spending, which would likely lift the 10-year yield toward the 5.00% to 5.05% supply zone and the dollar index toward 102.48 and the 102.55 to 102.63 supply zone. That would pressure gold, lift USD/JPY and push EUR/USD toward its 1.1105 low zone. A contested or delayed result would add volatility instead, and StoneX flags that it could weigh on the dollar and US indices until the outcome is clear, so wait for confirmation.
Risk Warning: Trading financial instruments, particularly those involving leverage, involves a substantial degree of risk and is not appropriate for all investors. The value of your investments can rise or fall sharply, and it is possible to lose the entirety of your invested capital. Do not trade with funds you cannot afford to lose. Nothing in this site should be read or construed as constituting advice on the part of Taurex or any of its affiliates, directors, officers or employees.