
The USD/SEK pair continues its downward trend, recording 9.9630 yesterday, its lowest level since December 29, 2023. The pair has declined by approximately 12% from its peak of 11.3101 on January 13, 2025, to the low recorded yesterday at 9.9630.
Recent Swedish economic data indicates that the Swedish economy has begun to improve, as:
• The Consumer Price Index (CPI) on an annual basis increased by 1.3% in February, exceeding expectations (1.1%) and the previous reading (0.9%).
• The Manufacturing PMI rose to 53.5 in February, higher than the previous reading of 53.1.
• The Services PMI increased to 50.8 in February, surpassing the previous reading of 50.2.
• The Gross Domestic Product (GDP) on a quarterly basis for Q4 of last year grew by 0.8%, exceeding expectations (0.2%) and the previous reading (0.3%).
A key factor contributing to the downward momentum of the USD/SEK pair is the slowdown in some U.S. economic indicators, such as labor market performance and inflation. Additionally, concerns about a potential U.S. economic recession, uncertainty surrounding trade wars, and a significant decline in U.S. Treasury yields across various maturities have all put pressure on the U.S. dollar against most foreign currencies.
Analysts are closely watching the release of the U.S. Consumer Price Index today at 17:30 UAE time. Caution is advised, as any reading exceeding expectations could have a positive impact on the USD/SEK pair.
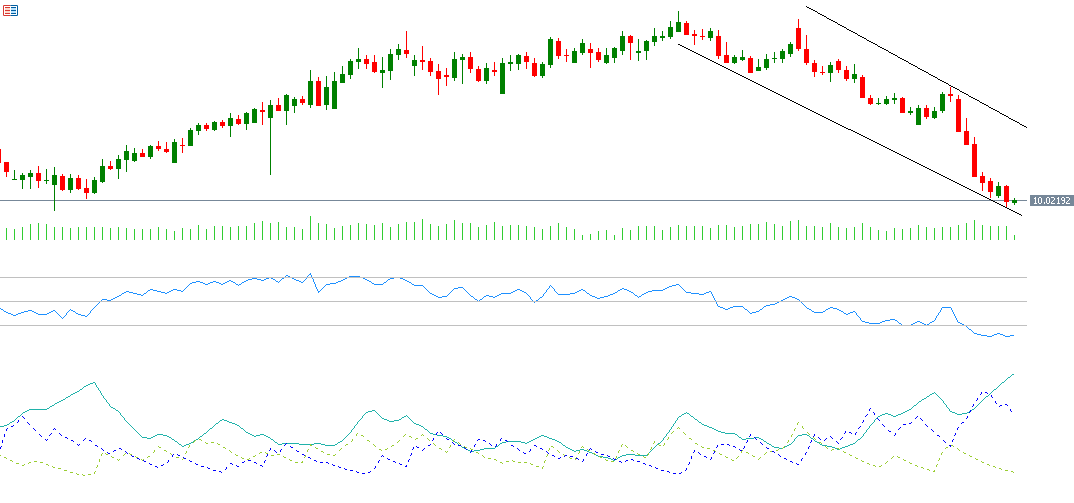
Technical Analysis:
If the pivot point at 10.0423 for USD/SEK is broken, the pair may target support levels at 9.9465, 9.8794, and 9.7836. Conversely, if the pair surpasses the pivot point, it may aim for resistance levels at 10.1094, 10.2052, and 10.2723.
The Relative Strength Index (RSI) is currently at 22, indicating that the pair is in an oversold zone, reflecting negative momentum for the USD/SEK pair.
The Positive Directional Index (DMI+) is around 9, while the Negative Directional Index (DMI-) is approximately 42. The significant gap between these indicators suggests strong selling pressure on the U.S. dollar against the Swedish krona. Most notably, the Average Directional Index (ADX) is around 36, highlighting the strength of the bearish trend momentum.
Please note that this analysis is provided for informational purposes only and should not be considered as investment advice. All trading involves risk.


