

The abandoned baby pattern is one of the rarest and most respected bullish reversal signals in Forex trading. Unlike candlestick formations that appear several times a day, its strict structure filters out a lot of market noise, which is exactly why traders pay attention when it does show up at the bottom of a downtrend.
This guide explains what the pattern is, how it forms candle by candle, how to confirm it, and how to trade it on an online trading platform, plus the mistakes that cause most traders to misread it. For those still building a foundation, an introduction to Forex trading is a useful starting point.
What Is the Abandoned Baby Pattern?
The abandoned baby pattern is a three-candle bullish reversal formation that appears at the bottom of a downtrend. It gets its name from the middle candle, a Doji that is completely separated on both sides by price gaps, making it look isolated from the rest of the price action.
In simple terms, it reflects a sudden drop in selling pressure followed by a strong shift where buyers take control. Because the structure is so strict, it does not appear often, which is why it is considered a relatively strong reversal signal.
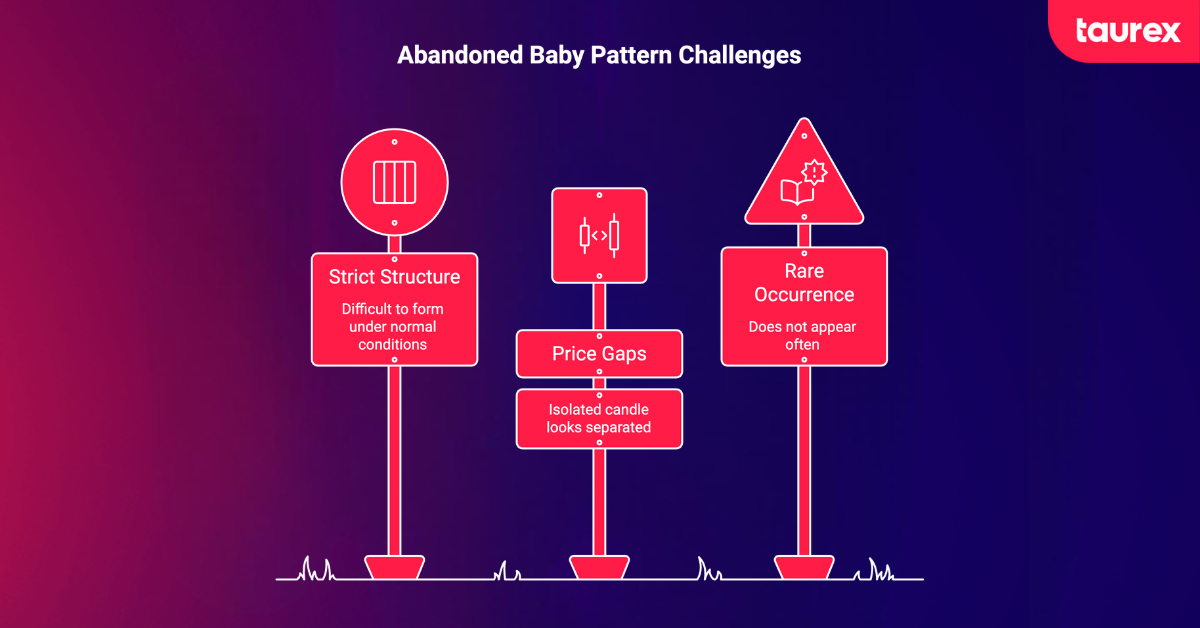
The pattern is viewed as a strong bullish reversal setup because the gap requirements make it difficult to form under normal market conditions. Both bullish and bearish versions exist, but this guide focuses on the bullish abandoned baby, which signals a potential shift from a downtrend to an uptrend.
How the Bullish Abandoned Baby Pattern Forms
Understanding the structure of the three candles is the best way to recognise this setup when it appears on a live chart.
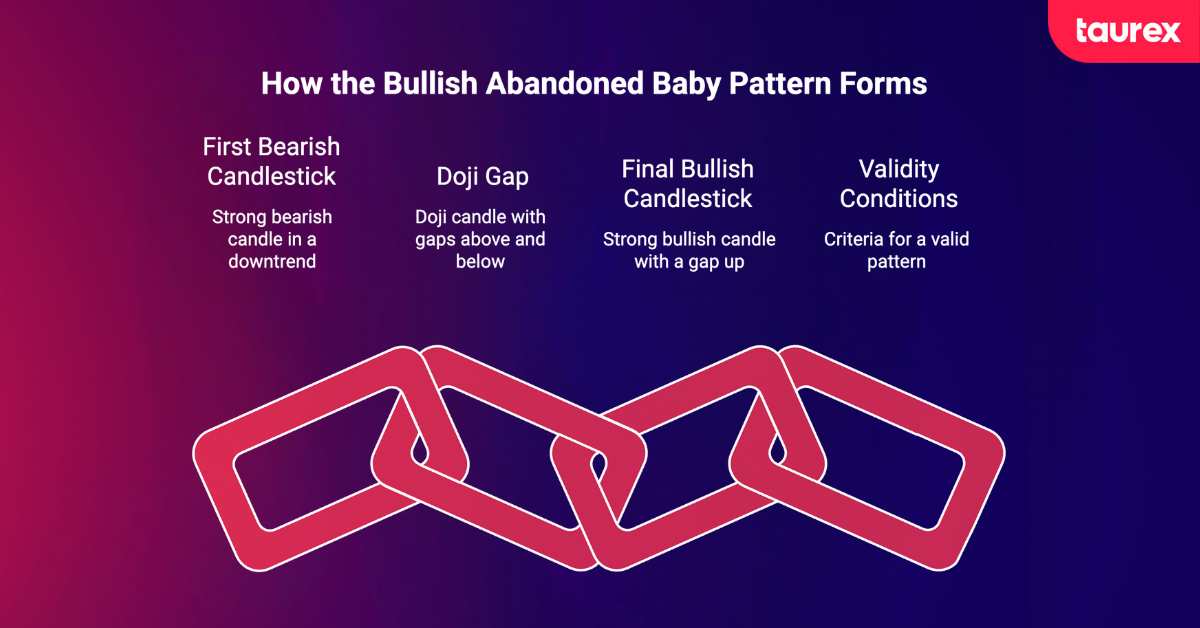
The First Bearish Candlestick
The first candle is a strong bearish candle within an established downtrend, ideally with a clear body and little indecision. It confirms sellers are still in control and sets the stage for the reversal that follows.
The Doji Gap
The second candle is the key feature of the pattern and what makes the bullish abandoned baby candlestick pattern distinct from other reversal formations. It opens with a gap down below the previous candle and forms a Doji, where the open and close are nearly identical.
The most important rule is that this Doji must be completely isolated. Its wicks should not overlap with the first or third candle. This gap on both sides is what defines the abandoned baby pattern and separates it from similar-looking formations. Traders interested in how gaps behave across different setups may also find it useful to explore price gap trading strategies in Forex more broadly.
In essence, this candle reflects a moment of complete indecision, where selling pressure fades, and the market temporarily pauses.
The Final Bullish Candlestick
The third candle opens with a gap up above the Doji and closes strongly in bullish territory. This confirms that buyers have taken control.
The two gaps on either side of the Doji are what make the structure valid, as they isolate the middle candle and signal a potential shift in momentum.
What Makes a Valid Abandoned Baby Pattern
Before treating the setup as valid, check the following conditions:
- A clear downtrend must be in place before the pattern forms
- A strong bearish candle appears first
- A true Doji gaps down and remains isolated with no wick overlap
- A strong bullish candle gaps up to complete the formation
If the Doji touches either of the surrounding candles, the pattern is invalid. It must also be a true Doji, not a small-bodied candle that only resembles one.
How to Identify an Abandoned Baby Pattern on a Forex Chart
Spotting an abandoned baby pattern in Forex can be challenging because true price gaps are less common than they are in stock markets. Since the Forex market hours are open almost 24 hours a day, the gaps needed to form this pattern do not appear very often.
According to the BIS Triennial Central Bank Survey, trading in global foreign exchange markets reached $9.6 trillion per day in April 2025, showing how liquid and continuous the market is compared with many exchange-traded markets.
Key Characteristics to Look For
Look for the following features:
- A clear downtrend before the pattern forms
- A strong bearish candle followed by a genuine gap down
- A true Doji with no wick overlap on either side
- A gap up into a strong bullish candle
- A Doji that appears visually isolated between the two larger candles
Best Timeframes for the Pattern
Research from Volity suggests that the pattern performs best on higher timeframes. The 4-hour chart has shown some of the strongest results, followed closely by the daily chart. Weekly charts can also produce valid signals, although they appear very rarely.
On lower timeframes, such as the 1-minute and 5-minute charts, the pattern tends to be less reliable because market noise can create more false signals.
In Forex, valid gaps are most likely to appear around the weekly market open, after major economic news events, or at the start of a session following opening range breakout strategies.
Common False Signals
Not every setup that resembles an abandoned baby is valid. Watch out for these common mistakes:
- The Doji’s wick overlaps with either neighbouring candle
- The middle candle is not a true Doji
- The pattern forms in a sideways market rather than a downtrend
- Apparent gaps are caused by low liquidity or spread fluctuations rather than genuine price gaps
A good understanding of chart structure and price action can help you avoid these false signals and focus on higher-quality setups. Be mindful that a widening Forex spread during low-liquidity periods can sometimes mimic the appearance of a gap, leading to misidentification.
How to Trade the Abandoned Baby Pattern in Forex
Once you have confirmed a valid abandoned baby candle pattern, the next step is planning your entry, stop-loss, and profit target. A structured approach helps improve consistency and manage risk more effectively.
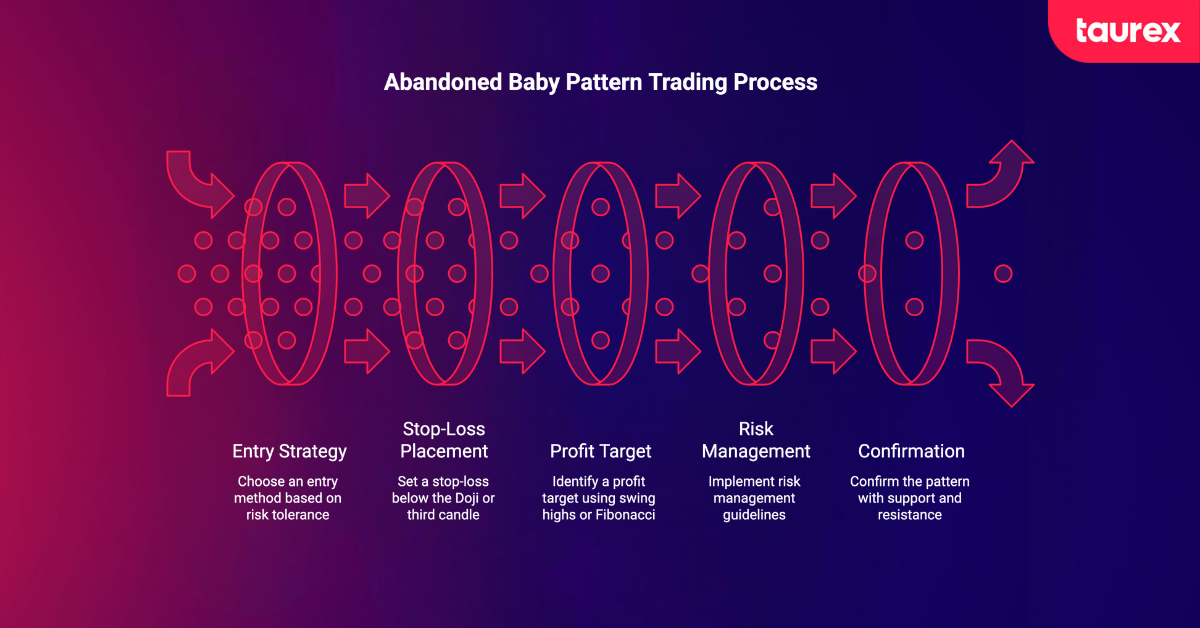
Entry Strategies
There are several ways traders enter after the pattern forms:
- Conservative entry: Enter at the close of the third bullish candle after the pattern is fully confirmed.
- Moderate entry: Enter at the open of the third candle after the gap up for earlier participation.
- Breakout entry: Wait for a brief consolidation after the pattern forms and enter when the price breaks above that range.
We’ve noticed that entry timing can affect overall performance, which is why many traders choose the approach that best matches their risk tolerance and trading style. Those who also apply Forex news trading strategies may find that the pattern carries additional weight when it forms around high-impact economic releases.
Familiarity with the different types of Forex orders lets you put these entries into practice cleanly.
Stop-Loss Placement
A common stop sits below the low of the Doji candle, beneath the structure that defines the pattern. Some traders use a tighter stop below the low of the third candle, which leaves less room for normal fluctuations.
As a rule, a close back below the Doji generally invalidates the setup.
Profit Targets and Risk Management
A common profit target is the previous swing high that existed before the downtrend began.
Many traders also use Fibonacci retracement levels to identify potential target areas. The 78.6% level is often watched because it can align with previous resistance zones.
Basic risk management guidelines include:
- Risking no more than a small percentage of trading capital on a single trade
- Targeting a reward-to-risk ratio of at least 2:1
- Using a trailing stop to protect profits if the trend continues
- Monitoring Forex drawdown to ensure losses remain within acceptable limits across a series of trades
Using Support and Resistance for Confirmation
The abandoned baby candle pattern tends to be more reliable when it forms near an established support level. Additional confirmation can come from:
- Previous swing lows
- Horizontal support zones
- Round-number price levels
- Other technical signals that align with the pattern
The more factors that support the setup, the stronger the potential trading opportunity may be.
How to Confirm an Abandoned Baby Pattern Before Entering a Trade
The abandoned baby pattern can be a strong reversal signal on its own, but adding confirmation tools can help filter out weaker setups and improve trade quality.
Volume and Momentum Confirmation
Volume can provide valuable insight into the strength of the reversal.
- Rising volume on the third bullish candle can signal strong buying interest.
- A volume spike around the Doji may suggest that selling pressure is fading.
- Weak volume on the bullish confirmation candle may indicate a less reliable signal.
The stronger the participation behind the move, the greater the confidence traders typically have in the reversal.
RSI Confirmation
The Relative Strength Index (RSI) can help confirm whether the market is oversold. Common signals include:
- An RSI reading below 30 when the pattern forms
- RSI moving back above 30 after the pattern appears
- Bullish RSI divergence, where price makes lower lows while RSI makes higher lows
These signals can suggest that bearish momentum is weakening and that a reversal may be developing.
MACD Confirmation
The MACD indicator can also help validate the pattern.
Look for:
- A bullish MACD crossover, where the MACD line moves above the signal line
- A shrinking MACD histogram, showing that bearish momentum is fading
- Bullish divergence between price and the MACD indicator
When these signals appear alongside the abandoned baby pattern, they can provide additional confidence in the potential reversal.
MACD divergence during the downtrend can act as a pre-pattern signal that selling is losing grip, much like the broader divergence trading strategy approach.
Trendline and Price Action Confirmation
Price action and chart structure can offer further confirmation.
Useful signals include:
- A break above a descending trendline
- The pattern forming near a key Fibonacci support level
- The candle after the pattern holding above the Doji’s high
- A bullish move through a nearby resistance level
When multiple confirmation factors align, traders often view the setup as having a higher probability of success.
Abandoned Baby Pattern vs Morning Star: Which Is More Reliable?
These two patterns look similar at a glance, and the distinction matters. The difference comes down to strictness.
| Feature | Abandoned Baby | Morning Star |
| Middle candle | Must be a Doji | Any small-body candle |
| Gaps | Mandatory, shadows cannot overlap | Optional, shadows may overlap |
| Frequency | Extremely rare | Common (20–30 per month) |
| Reliability | Higher (stricter criteria) | Moderate |
| Forex applicability | Harder to find | More frequently spotted |
The abandoned baby pattern is often considered more reliable because its criteria are much stricter. Every abandoned baby is effectively a Morning Star, but not every Morning Star qualifies as an abandoned baby.
The key difference is the isolated Doji and the required gaps on both sides. As a result, Morning Stars appear more frequently, while abandoned baby patterns are rarer and generally viewed as higher-quality reversal signals.
Common Mistakes Traders Must Avoid with the Abandoned Baby Pattern
The abandoned baby pattern can be a powerful signal, but only when it is identified and traded correctly. Here are some of the most common mistakes traders make.
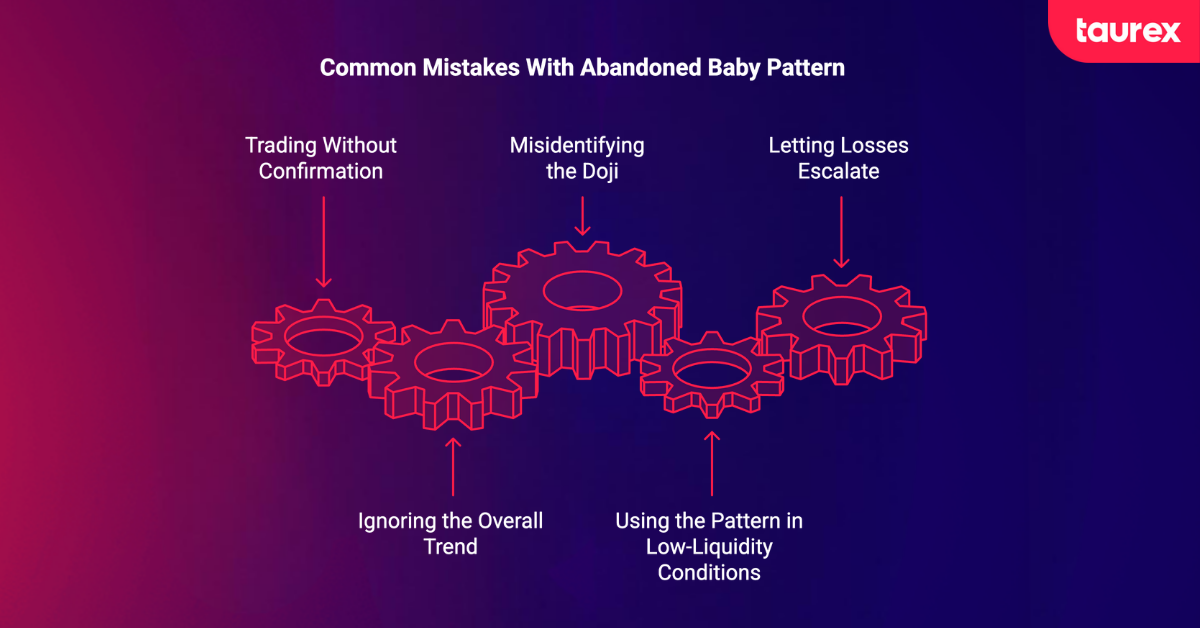
- Trading the Pattern Without Confirmation: The pattern should not be traded in isolation. Entering without confirmation from tools such as volume, RSI, or MACD can increase the risk of false signals. It is also important to wait for the third candle to close before treating the pattern as complete.
- Ignoring the Overall Trend: The abandoned baby is a reversal pattern, which means it works best after a clear downtrend. When it appears in a sideways or choppy market, its reliability tends to decrease. Always check the broader market trend before taking a trade.
- Misidentifying the Doji: One of the most common mistakes is treating any small-bodied candle as a Doji. For the pattern to be valid, the middle candle should be a true Doji and remain isolated from the candles on either side. If the wicks overlap, the setup does not qualify as an abandoned baby candlestick pattern.
- Using the Pattern in Low-Liquidity Conditions: Low-liquidity markets can create misleading price gaps that are caused by thin trading activity rather than a genuine shift in sentiment. For this reason, many traders focus on major and minor currency pairs during the most active trading sessions.
- Letting Losses Escalate After a Failed Signal: When the pattern does not play out as expected, it is important to exit promptly and avoid the temptation of revenge trading, which can quickly compound losses and undermine your overall risk management plan.
Advantages and Limitations of the Abandoned Baby Pattern
Advantages:
- High signal quality, since strict rules filter out a lot of noise
- Precise stop-loss placement, because the Doji gives a clear reference point
- Early entry into a potential trend reversal
- Works across Forex, stocks, indices, and futures
- Visually distinctive and straightforward to verify once you know what to look for
Limitations:
- Extremely rare in spot Forex, especially on intraday timeframes
- Overnight gaps are uncommon in 24-hour currency markets
- Best results require additional confirmation tools rather than the pattern alone
- Lower reliability below the 1-hour timeframe
- False signals are possible in low-liquidity markets or right after major news
No candlestick pattern guarantees an outcome, and the abandoned baby is no exception. Disciplined risk management remains the foundation of any approach you take to the market.
Final Thoughts
The abandoned baby pattern is rare, but that is part of what makes it valuable. When it appears after a clear downtrend and is supported by strong confirmation signals, it can highlight a potential turning point in the market.
The key is to focus on the bigger picture. Always consider the trend, wait for confirmation, manage risk carefully, and choose the timeframe that best fits your trading style.
An online trading platform like Taurex provides the tools, charting platforms, and educational resources traders need to build confidence in their market analysis. Whether you are studying candlestick patterns, testing new strategies, or refining your approach, our MT4 and MT5 platforms make it easy to put what you learn into practice.
Ready to test the abandoned baby pattern for yourself? Open a free demo account and practice trading in real market conditions without risking capital.
FAQ
What is an abandoned baby pattern in Forex?
The abandoned baby pattern is a three-candlestick reversal formation consisting of a large bearish candle, an isolated Doji, and a strong bullish candle. It can signal the end of a downtrend and the beginning of a potential upward move.
Is the abandoned baby pattern bullish or bearish?
Both bullish and bearish versions exist. The bullish abandoned baby forms after a downtrend and signals a potential upward reversal, while the bearish version appears after an uptrend and signals a possible move lower. This article focuses on the bullish pattern.
How reliable is the abandoned baby pattern?
The abandoned baby is generally considered one of the more reliable candlestick reversal patterns because of its strict formation rules. It tends to perform best on higher timeframes, where market noise is lower, and signals are clearer.
What is the difference between an abandoned baby and a Morning Star?
The main difference is the isolated Doji. In an abandoned baby candlestick pattern, the Doji must be separated from the surrounding candles by clear price gaps with no wick overlap. A Morning Star does not require these gaps, making it a more common pattern.
Does the abandoned baby candle pattern work in Forex markets?
Yes, although it appears less frequently in Forex than in stocks because genuine price gaps are less common. When it does occur, it is often seen around major news events or the weekly market open.
Which timeframe is best for trading the abandoned baby pattern?
The 4-hour and daily charts are generally considered the most reliable timeframes for this pattern. Lower timeframes can produce more false signals because of increased market noise.
Do I need confirmation before trading an abandoned baby pattern?
Yes. Many traders look for confirmation from tools such as volume, RSI, MACD, support and resistance, or trendline breaks before entering a trade. Waiting for the third candle to close is also considered best practice.
Why is the abandoned baby pattern considered rare?
The pattern requires a true Doji that is isolated by price gaps on both sides, with no overlap from neighbouring candles. Because these conditions are difficult to meet, valid abandoned baby patterns appear much less frequently than most other candlestick formations.

